In gnuplot, I can do the following:
set format x "%.0s %cHz"
...and this will set the x-axis labels (on a semilogx style plot) to
be "10 Hz", "100 Hz", "1 kHz", "10 kHz", etc.
Is there an easy way to do this in matplotlib? I spent a while in the
matplotlib.ticker docs, but couldn't find anything.
Cheers,
Jason
Hi Jason,
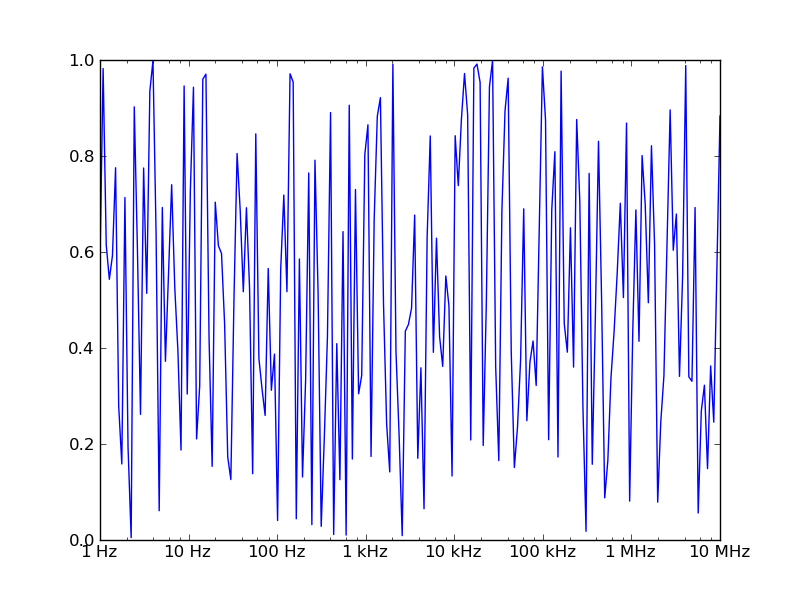
I think I found a solution. It might not be the best, but at least it works
for me using as FuncFormatter. Please have a look at the attached program and
the screenshot.
Kind regards
Matthias
Hz_ticker.py (580 Bytes)
···
On Wednesday 18 November 2009 06:05:44 Jason Heeris wrote:
In gnuplot, I can do the following:
set format x "%.0s %cHz"
...and this will set the x-axis labels (on a semilogx style plot) to
be "10 Hz", "100 Hz", "1 kHz", "10 kHz", etc.
Is there an easy way to do this in matplotlib? I spent a while in the
matplotlib.ticker docs, but couldn't find anything.
Cheers,
Jason
---------------------------------------------------------------------------
--- Let Crystal Reports handle the reporting - Free Crystal Reports 2008
30-Day trial. Simplify your report design, integration and deployment - and
focus on what you do best, core application coding. Discover what's new
with Crystal Reports now. http://p.sf.net/sfu/bobj-july
_______________________________________________
Matplotlib-users mailing list
Matplotlib-users@lists.sourceforge.net
matplotlib-users List Signup and Options
Hi,
2009/11/18 Jason Heeris <jason.heeris@...287...>:
In gnuplot, I can do the following:
set format x "%.0s %cHz"
...and this will set the x-axis labels (on a semilogx style plot) to
be "10 Hz", "100 Hz", "1 kHz", "10 kHz", etc.
I ended up implementing this myself, it wasn't too hard. I've attached
the code if anyone else is interested. I don't know matplotlib that
well, so I don't know if there's much duplication of code in there.
I thought I'd CC the dev list in case others think it might be useful.
If not, sorry for the noise.
Cheers,
Jason
EngFormatter.py (2.21 KB)
Hi Jason, Hi list,
First of all let me say I like the EngFormatter of Jason.
Are there plans to incorparate it into matplotlib?
I cannot find any indication for this in current svn, but I would like to see
the EngFormatter in matplotlib. Therefore I tried to include Jasons proposal
into the ticker.py as a new class EngFormatter including the
method 'self.format_eng'.
I made some changes, which might break some of Jasons ideas, but I cannot see
(1) why we need the LogFormatter as base class instead of Formatter?
(2) why one should decide for only decade-labels. Therefore I removed the
corresponding if-statement. It causes errors () if you use an axes
including '0', which could be useful for eng-formatting, too.
(3) Could we always use format_str = "%g %s" instead of
specifying 'places'? Because of successive zomming I don't want to
specify 'places' before calling 'plt.show'. Therefore I introduced "places
=None" to use "%g %s".
I attached the new ticker.py and a diff against current svn (I'm sorry I
couldn't resist to add some white spaces).
Any comments are welcome.
Kind regards,
Matthias Michler
ticker_EngFormatter.patch (5.51 KB)
ticker.py (42.9 KB)
···
On Wednesday 25 November 2009 01:39:43 Jason Heeris wrote:
Hi,
2009/11/18 Jason Heeris <jason.heeris@...287...>:
> In gnuplot, I can do the following:
>
> set format x "%.0s %cHz"
>
> ...and this will set the x-axis labels (on a semilogx style plot) to
> be "10 Hz", "100 Hz", "1 kHz", "10 kHz", etc.
I ended up implementing this myself, it wasn't too hard. I've attached
the code if anyone else is interested. I don't know matplotlib that
well, so I don't know if there's much duplication of code in there.
I thought I'd CC the dev list in case others think it might be useful.
If not, sorry for the noise.
Cheers,
Jason
I am interested in this -i I just missed Jason's original email last
week so thanks for bringing it back to our attention. Please post
this as a patch on the tracker
http://sourceforge.net/tracker2/?group_id=80706
since I don't have time to review it right now and I don't want it to
fall through the cracks.
JDH
···
On Wed, Dec 2, 2009 at 4:02 AM, Matthias Michler <MatthiasMichler@...361...> wrote:
Hi Jason, Hi list,
First of all let me say I like the EngFormatter of Jason.
Are there plans to incorparate it into matplotlib?
I cannot find any indication for this in current svn, but I would like to see
the EngFormatter in matplotlib. Therefore I tried to include Jasons proposal
into the ticker.py as a new class EngFormatter including the
method 'self.format_eng'.
Hi John, Hello list,
I added the patch to the tracker (ID 2907509).
Kind regards
Matthias
···
On Wednesday 02 December 2009 13:40:29 John Hunter wrote:
On Wed, Dec 2, 2009 at 4:02 AM, Matthias Michler > > <MatthiasMichler@...361...> wrote:
> Hi Jason, Hi list,
>
> First of all let me say I like the EngFormatter of Jason.
> Are there plans to incorparate it into matplotlib?
> I cannot find any indication for this in current svn, but I would like to
> see the EngFormatter in matplotlib. Therefore I tried to include Jasons
> proposal into the ticker.py as a new class EngFormatter including the
> method 'self.format_eng'.
I am interested in this -i I just missed Jason's original email last
week so thanks for bringing it back to our attention. Please post
this as a patch on the tracker
http://sourceforge.net/tracker2/?group_id=80706
since I don't have time to review it right now and I don't want it to
fall through the cracks.
JDH
Hi all,
I like this patch and it works fine. So if nobody is against including
this, I'll commit it in a few days.
I'll move the example from the class comment to an example script.
Cheers,
Reinier
···
On Wed, Dec 2, 2009 at 1:40 PM, John Hunter <jdh2358@...287...> wrote:
On Wed, Dec 2, 2009 at 4:02 AM, Matthias Michler > <MatthiasMichler@...361...> wrote:
Hi Jason, Hi list,
First of all let me say I like the EngFormatter of Jason.
Are there plans to incorparate it into matplotlib?
I cannot find any indication for this in current svn, but I would like to see
the EngFormatter in matplotlib. Therefore I tried to include Jasons proposal
into the ticker.py as a new class EngFormatter including the
method 'self.format_eng'.
I am interested in this -i I just missed Jason's original email last
week so thanks for bringing it back to our attention. Please post
this as a patch on the tracker
http://sourceforge.net/tracker2/?group_id=80706
since I don't have time to review it right now and I don't want it to
fall through the cracks.
JDH
------------------------------------------------------------------------------
Join us December 9, 2009 for the Red Hat Virtual Experience,
a free event focused on virtualization and cloud computing.
Attend in-depth sessions from your desk. Your couch. Anywhere.
http://p.sf.net/sfu/redhat-sfdev2dev
_______________________________________________
Matplotlib-users mailing list
Matplotlib-users@lists.sourceforge.net
matplotlib-users List Signup and Options
--
Reinier Heeres
Tel: +31 6 10852639