I am trying to plot two 1-D masked arrays against each other
in a line plot and an extraneous straight line appears on
the plot. This phenomenon only occurs sporadically and with
certain data sets. I have noticed a similar phenomenon with
masked arrow arrays, but that is much harder to track down.
The masked elements are intended to break the plot line so
that several independent polylines are plotted. (The purpose
is to plot a map of coastal outlines.)
I am attaching a python script which reproduces the problem,
but only with a particular data set, which is also attached.
Sorry, if I try to shorten the data set more than I have
already, the problem goes away, even if I split the file
in half an plot each half separately!
I am running on a 32 bit intel processor using debian testing
and the numpy and matplotlib versions are 1.3 and 0.99.1.2.
However, the problem also appears on a 64 bit amd processor
running debian stable with numpy and matplotlib versions
1.3 and 0.99.1.1.
The python script is named maskbug.py and the data set is
trunc1.dat, which is an ascii file. The data set should be
read on the standard input, i. e.,
maskbug.py < trunc1.dat
I have verified by printing the masked arrays that nothing
appears to go wrong in the conversion from ascii to numpy
masked array.
Dave Raymond
Physics Dept.
New Mexico Tech
Socorro, NM 87801
maskbug.py (815 Bytes)
trunc1.dat (2.6 KB)
I am trying to plot two 1-D masked arrays against each other
in a line plot and an extraneous straight line appears on
the plot. This phenomenon only occurs sporadically and with
certain data sets. I have noticed a similar phenomenon with
masked arrow arrays, but that is much harder to track down.
The masked elements are intended to break the plot line so
that several independent polylines are plotted. (The purpose
is to plot a map of coastal outlines.)
I am attaching a python script which reproduces the problem,
but only with a particular data set, which is also attached.
Sorry, if I try to shorten the data set more than I have
already, the problem goes away, even if I split the file
in half an plot each half separately!
I am running on a 32 bit intel processor using debian testing
and the numpy and matplotlib versions are 1.3 and 0.99.1.2.
However, the problem also appears on a 64 bit amd processor
running debian stable with numpy and matplotlib versions
1.3 and 0.99.1.1.
The python script is named maskbug.py and the data set is
trunc1.dat, which is an ascii file. The data set should be
read on the standard input, i. e.,
maskbug.py < trunc1.dat
I have verified by printing the masked arrays that nothing
appears to go wrong in the conversion from ascii to numpy
masked array.
Dave Raymond
Physics Dept.
New Mexico Tech
Socorro, NM 87801
Dave: Can you attach a png image showing what you get? When I run
your script, I get a plot that reasonable (no obviously crazy lines
running across the plot).
-Jeff
···
http://p.sf.net/sfu/intel-sw-dev
Matplotlib-devel@lists.sourceforge.nethttps://lists.sourceforge.net/lists/listinfo/matplotlib-devel
-- Jeffrey S. Whitaker Phone : (303)497-6313
Meteorologist FAX : (303)497-6449
NOAA/OAR/PSD R/PSD1 Email : 325 Broadway Office : Skaggs Research Cntr 1D-113
Boulder, CO, USA 80303-3328 Web :
Jeffrey.S.Whitaker@…236…http://tinyurl.com/5telg
I can't reproduce anything like a bug, either. What backend are you using? Have you tried turning path.simplify on or off? (Makes no difference here, just seems a likely candidate).
Mike
Jeff Whitaker wrote:
···
On 3/19/10 11:10 AM, David J. Raymond wrote:
I am trying to plot two 1-D masked arrays against each other
in a line plot and an extraneous straight line appears on
the plot. This phenomenon only occurs sporadically and with
certain data sets. I have noticed a similar phenomenon with
masked arrow arrays, but that is much harder to track down.
The masked elements are intended to break the plot line so
that several independent polylines are plotted. (The purpose
is to plot a map of coastal outlines.)
I am attaching a python script which reproduces the problem,
but only with a particular data set, which is also attached.
Sorry, if I try to shorten the data set more than I have
already, the problem goes away, even if I split the file
in half an plot each half separately!
I am running on a 32 bit intel processor using debian testing
and the numpy and matplotlib versions are 1.3 and 0.99.1.2.
However, the problem also appears on a 64 bit amd processor
running debian stable with numpy and matplotlib versions
1.3 and 0.99.1.1.
The python script is named maskbug.py and the data set is
trunc1.dat, which is an ascii file. The data set should be
read on the standard input, i. e.,
maskbug.py < trunc1.dat
I have verified by printing the masked arrays that nothing
appears to go wrong in the conversion from ascii to numpy
masked array.
Dave Raymond
Physics Dept.
New Mexico Tech
Socorro, NM 87801
Dave: Can you attach a png image showing what you get? When I run your script, I get a plot that reasonable (no obviously crazy lines running across the plot).
-Jeff
------------------------------------------------------------------------------
Download Intel® Parallel Studio Eval
Try the new software tools for yourself. Speed compiling, find bugs
proactively, and fine-tune applications for parallel performance.
See why Intel Parallel Studio got high marks during beta.
http://p.sf.net/sfu/intel-sw-dev
_______________________________________________
Matplotlib-devel mailing list
Matplotlib-devel@lists.sourceforge.net
matplotlib-devel List Signup and Options
--
Jeffrey S. Whitaker Phone : (303)497-6313
Meteorologist FAX : (303)497-6449
NOAA/OAR/PSD R/PSD1 Email : Jeffrey.S.Whitaker@...236...
325 Broadway Office : Skaggs Research Cntr 1D-113
Boulder, CO, USA 80303-3328 Web : Jeffrey S. Whitaker: NOAA Physical Sciences Laboratory
------------------------------------------------------------------------
------------------------------------------------------------------------------
Download Intel® Parallel Studio Eval
Try the new software tools for yourself. Speed compiling, find bugs
proactively, and fine-tune applications for parallel performance.
See why Intel Parallel Studio got high marks during beta.
http://p.sf.net/sfu/intel-sw-dev
------------------------------------------------------------------------
_______________________________________________
Matplotlib-devel mailing list
Matplotlib-devel@lists.sourceforge.net
matplotlib-devel List Signup and Options
--
Michael Droettboom
Science Software Branch
Operations and Engineering Division
Space Telescope Science Institute
Operated by AURA for NASA
I am using python 2.5.5 and the gtk background (as far as I can tell).
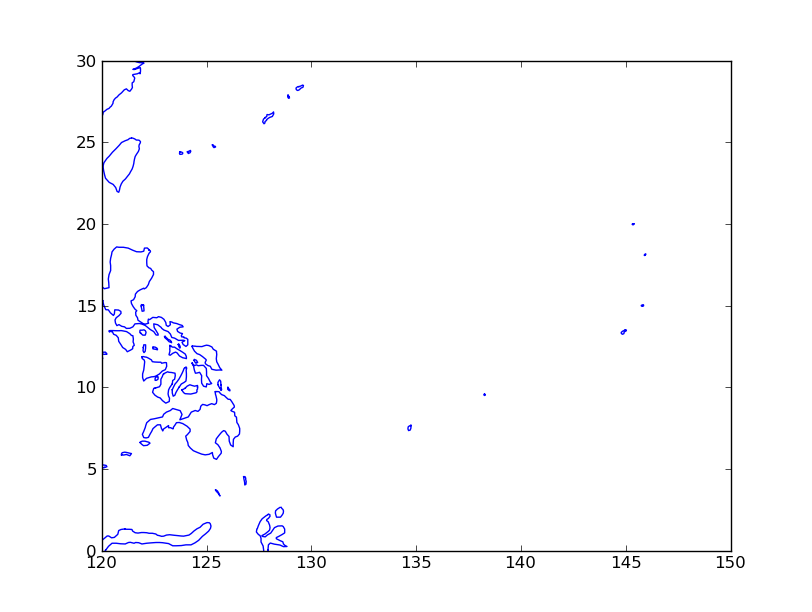
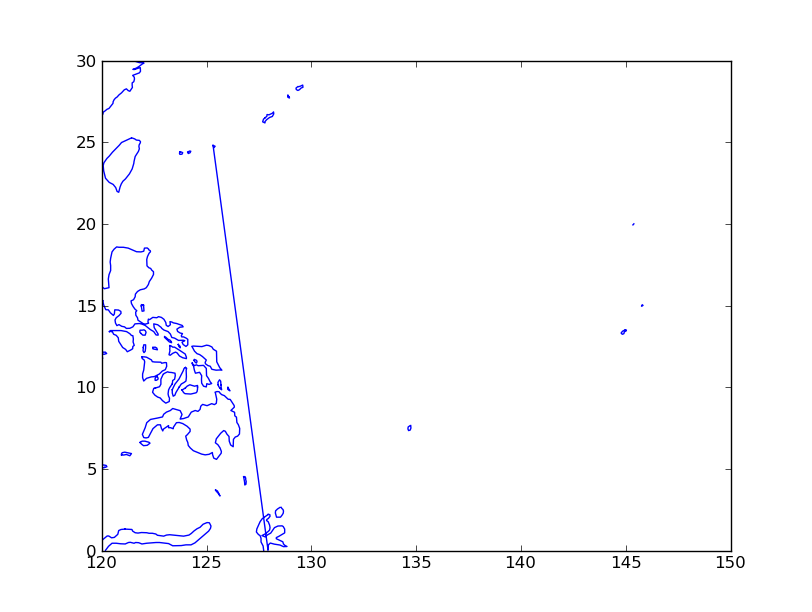
Turning off path.simplify gets rid of the extraneous line. I am
attaching pngs with path.simplify both on and off. I am also
attaching the full coastline file that produced the original problem.
I noticed that the behavior was a bit weird, with the bad line
appearing or disappearing in apparently random ways depending on what
was edited out of the input file.
By the way, I notice that the default value of
'path.simplify_threshold' is 0.1111... I don't quite know what this
means, but it sounds pertinent.
I assume path.simplify is some kind of optimization scheme?
Dave
coastline.dat (22.4 KB)
···
On Fri, Mar 19, 2010 at 03:13:04PM -0400, Michael Droettboom wrote:
I can't reproduce anything like a bug, either. What backend are you
using? Have you tried turning path.simplify on or off? (Makes no
difference here, just seems a likely candidate).
Mike
Jeff Whitaker wrote:
>On 3/19/10 11:10 AM, David J. Raymond wrote:
>>I am trying to plot two 1-D masked arrays against each other
>>in a line plot and an extraneous straight line appears on
>>the plot. This phenomenon only occurs sporadically and with
>>certain data sets. I have noticed a similar phenomenon with
>>masked arrow arrays, but that is much harder to track down.
>>The masked elements are intended to break the plot line so
>>that several independent polylines are plotted. (The purpose
>>is to plot a map of coastal outlines.)
>>
>>I am attaching a python script which reproduces the problem,
>>but only with a particular data set, which is also attached.
>>Sorry, if I try to shorten the data set more than I have
>>already, the problem goes away, even if I split the file
>>in half an plot each half separately!
>>
>>I am running on a 32 bit intel processor using debian testing
>>and the numpy and matplotlib versions are 1.3 and 0.99.1.2.
>>However, the problem also appears on a 64 bit amd processor
>>running debian stable with numpy and matplotlib versions
>>1.3 and 0.99.1.1.
>>
>>The python script is named maskbug.py and the data set is
>>trunc1.dat, which is an ascii file. The data set should be
>>read on the standard input, i. e.,
>>
>> maskbug.py < trunc1.dat
>>
>>I have verified by printing the masked arrays that nothing
>>appears to go wrong in the conversion from ascii to numpy
>>masked array.
>>
>>Dave Raymond
>>Physics Dept.
>>New Mexico Tech
>>Socorro, NM 87801
>
>Dave: Can you attach a png image showing what you get? When I
>run your script, I get a plot that reasonable (no obviously crazy
>lines running across the plot).
>
>-Jeff
>>
>>
>>------------------------------------------------------------------------------
>>Download Intel® Parallel Studio Eval
>>Try the new software tools for yourself. Speed compiling, find bugs
>>proactively, and fine-tune applications for parallel performance.
>>See why Intel Parallel Studio got high marks during beta.
>>http://p.sf.net/sfu/intel-sw-dev
>>
>>
>>_______________________________________________
>>Matplotlib-devel mailing list
>>Matplotlib-devel@lists.sourceforge.net
>>matplotlib-devel List Signup and Options
>
>
>--
>Jeffrey S. Whitaker Phone : (303)497-6313
>Meteorologist FAX : (303)497-6449
>NOAA/OAR/PSD R/PSD1 Email : Jeffrey.S.Whitaker@...236...
>325 Broadway Office : Skaggs Research Cntr 1D-113
>Boulder, CO, USA 80303-3328 Web : Jeffrey S. Whitaker: NOAA Physical Sciences Laboratory
>------------------------------------------------------------------------
>
>------------------------------------------------------------------------------
>Download Intel® Parallel Studio Eval
>Try the new software tools for yourself. Speed compiling, find bugs
>proactively, and fine-tune applications for parallel performance.
>See why Intel Parallel Studio got high marks during beta.
>http://p.sf.net/sfu/intel-sw-dev
>------------------------------------------------------------------------
>
>_______________________________________________
>Matplotlib-devel mailing list
>Matplotlib-devel@lists.sourceforge.net
>matplotlib-devel List Signup and Options
--
Michael Droettboom
Science Software Branch
Operations and Engineering Division
Space Telescope Science Institute
Operated by AURA for NASA
David J. Raymond wrote:
I am using python 2.5.5 and the gtk background (as far as I can tell).
Turning off path.simplify gets rid of the extraneous line. I am
attaching pngs with path.simplify both on and off. I am also
attaching the full coastline file that produced the original problem.
I noticed that the behavior was a bit weird, with the bad line
appearing or disappearing in apparently random ways depending on what
was edited out of the input file.
This looks to me like a bug that Mike fixed, maybe the one where a path was not always starting with a move_to. That was fixed on October 22.
By the way, I notice that the default value of
'path.simplify_threshold' is 0.1111... I don't quite know what this
means, but it sounds pertinent.
I assume path.simplify is some kind of optimization scheme?
Yes, it is a very fancy and nice set of algorithms for eliminating path elements that would not make any visible difference to the output. It makes it possible to plot very large datasets.
Eric
···
Dave
On Fri, Mar 19, 2010 at 03:13:04PM -0400, Michael Droettboom wrote:
I can't reproduce anything like a bug, either. What backend are you
using? Have you tried turning path.simplify on or off? (Makes no
difference here, just seems a likely candidate).
Mike
Jeff Whitaker wrote:
On 3/19/10 11:10 AM, David J. Raymond wrote:
I am trying to plot two 1-D masked arrays against each other
in a line plot and an extraneous straight line appears on
the plot. This phenomenon only occurs sporadically and with
certain data sets. I have noticed a similar phenomenon with
masked arrow arrays, but that is much harder to track down.
The masked elements are intended to break the plot line so
that several independent polylines are plotted. (The purpose
is to plot a map of coastal outlines.)
I am attaching a python script which reproduces the problem,
but only with a particular data set, which is also attached.
Sorry, if I try to shorten the data set more than I have
already, the problem goes away, even if I split the file
in half an plot each half separately!
I am running on a 32 bit intel processor using debian testing
and the numpy and matplotlib versions are 1.3 and 0.99.1.2.
However, the problem also appears on a 64 bit amd processor
running debian stable with numpy and matplotlib versions
1.3 and 0.99.1.1.
The python script is named maskbug.py and the data set is
trunc1.dat, which is an ascii file. The data set should be
read on the standard input, i. e.,
maskbug.py < trunc1.dat
I have verified by printing the masked arrays that nothing
appears to go wrong in the conversion from ascii to numpy
masked array.
Dave Raymond
Physics Dept.
New Mexico Tech
Socorro, NM 87801
Dave: Can you attach a png image showing what you get? When I
run your script, I get a plot that reasonable (no obviously crazy
lines running across the plot).
-Jeff
------------------------------------------------------------------------------
Download Intel® Parallel Studio Eval
Try the new software tools for yourself. Speed compiling, find bugs
proactively, and fine-tune applications for parallel performance.
See why Intel Parallel Studio got high marks during beta.
http://p.sf.net/sfu/intel-sw-dev
_______________________________________________
Matplotlib-devel mailing list
Matplotlib-devel@lists.sourceforge.net
matplotlib-devel List Signup and Options
--
Jeffrey S. Whitaker Phone : (303)497-6313
Meteorologist FAX : (303)497-6449
NOAA/OAR/PSD R/PSD1 Email : Jeffrey.S.Whitaker@...236...
325 Broadway Office : Skaggs Research Cntr 1D-113
Boulder, CO, USA 80303-3328 Web : Jeffrey S. Whitaker: NOAA Physical Sciences Laboratory
------------------------------------------------------------------------
------------------------------------------------------------------------------
Download Intel® Parallel Studio Eval
Try the new software tools for yourself. Speed compiling, find bugs
proactively, and fine-tune applications for parallel performance.
See why Intel Parallel Studio got high marks during beta.
http://p.sf.net/sfu/intel-sw-dev
------------------------------------------------------------------------
_______________________________________________
Matplotlib-devel mailing list
Matplotlib-devel@lists.sourceforge.net
matplotlib-devel List Signup and Options
--
Michael Droettboom
Science Software Branch
Operations and Engineering Division
Space Telescope Science Institute
Operated by AURA for NASA
------------------------------------------------------------------------
------------------------------------------------------------------------
------------------------------------------------------------------------
------------------------------------------------------------------------------
Download Intel® Parallel Studio Eval
Try the new software tools for yourself. Speed compiling, find bugs
proactively, and fine-tune applications for parallel performance.
See why Intel Parallel Studio got high marks during beta.
http://p.sf.net/sfu/intel-sw-dev
------------------------------------------------------------------------
_______________________________________________
Matplotlib-devel mailing list
Matplotlib-devel@lists.sourceforge.net
matplotlib-devel List Signup and Options
Would this fix have made it into version 0.99.1.2 which I am currently
using?
Dave
···
On Fri, Mar 19, 2010 at 05:47:05PM -1000, Eric Firing wrote:
David J. Raymond wrote:
>I am using python 2.5.5 and the gtk background (as far as I can tell).
>Turning off path.simplify gets rid of the extraneous line. I am
>attaching pngs with path.simplify both on and off. I am also
>attaching the full coastline file that produced the original problem.
>I noticed that the behavior was a bit weird, with the bad line
>appearing or disappearing in apparently random ways depending on what
>was edited out of the input file.
This looks to me like a bug that Mike fixed, maybe the one where a
path was not always starting with a move_to. That was fixed on
October 22.