I tried porting anim.py to TkAgg this morning and got it
> basically working. There are two things that might account
> for the trouble you've been having:
> 1. With TkAgg, at least for now, you have to call the
> figure manager show() method with each cycle rather than the
> canvas draw() method.
Would it be possible to reorganize tkagg so that a call to canvas.draw
also triggers a blit so that the interface could be more consistent
across backends?
> 2. The Tk timed event system requires re-registering the
> handler with each cycle.
Or you can do something like this
def updatefig(*args):
updatefig.count += 1
lines[0].set_ydata(X[:,updatefig.count%60])
manager.show()
return updatefig.count
updatefig.count=-1
while 1:
cnt = updatefig()
if cnt==100: break
> Performance was better than I thought it would be but still
> kinda slow.
I profiled this because it was slower than I expected. Turns out that
there is a huge performance hit in the changes I made to Text to
handle arbitrary rotations (a lot of time spent in Matrix getitem,
multiply, etc...). With text I could get only 5 frames per second;
w/o text I get 13 fps. The good news is that it will be easy to
optimize away most of the text based performance hit using more
efficient matrix operations and caching.
This can likely be improved further by using collections for drawing
markers in the line class.
Gary: did Todd's example help you enough to speed you on your way?
JDH
I've been on leave a lot today but I'll take a look at this either this
evening or tomorrow morning.
Todd
···
On Tue, 2004-05-25 at 11:13, John Hunter wrote:
> I tried porting anim.py to TkAgg this morning and got it
> basically working. There are two things that might account
> for the trouble you've been having:
> 1. With TkAgg, at least for now, you have to call the
> figure manager show() method with each cycle rather than the
> canvas draw() method.
Would it be possible to reorganize tkagg so that a call to canvas.draw
also triggers a blit so that the interface could be more consistent
across backends?
This turned out to be really easy so now canvas.draw triggers a blit and
functions more like the other backends. It's in CVS. I also found an
extraneous draw() so performance should be better, perhaps 2x.
Cheers,
Todd
···
On Tue, 2004-05-25 at 17:11, Todd Miller wrote:
On Tue, 2004-05-25 at 11:13, John Hunter wrote:
>
> > I tried porting anim.py to TkAgg this morning and got it
> > basically working. There are two things that might account
> > for the trouble you've been having:
>
> > 1. With TkAgg, at least for now, you have to call the
> > figure manager show() method with each cycle rather than the
> > canvas draw() method.
>
> Would it be possible to reorganize tkagg so that a call to canvas.draw
> also triggers a blit so that the interface could be more consistent
> across backends?
I've been on leave a lot today but I'll take a look at this either this
evening or tomorrow morning.
Hi:
The following script:
#!/usr/bin/env python
from matplotlib.matlab import *
figure(1)
plot([0],[0])
show()
gives this traceback:
Traceback (most recent call last):
File "/usr/lib/python2.2/site-packages/matplotlib/backends/backend_gtkagg.py", line 75, in callback
self.draw()
File "/usr/lib/python2.2/site-packages/matplotlib/backends/backend_gtkagg.py", line 42, in draw
agg.draw()
File "/usr/lib/python2.2/site-packages/matplotlib/backends/backend_agg.py", line 299, in draw
self.figure.draw(self.renderer)
File "/usr/lib/python2.2/site-packages/matplotlib/figure.py", line 128, in draw
for a in self.axes: a.draw(renderer)
File "/usr/lib/python2.2/site-packages/matplotlib/axes.py", line 603, in draw
self.xaxis.draw(renderer)
File "/usr/lib/python2.2/site-packages/matplotlib/axis.py", line 463, in draw
tick.draw(renderer)
File "/usr/lib/python2.2/site-packages/matplotlib/axis.py", line 130, in draw
if self.label1On: self.label1.draw(renderer)
File "/usr/lib/python2.2/site-packages/matplotlib/text.py", line 202, in draw
ismath=self.is_math_text())
File "/usr/lib/python2.2/site-packages/matplotlib/backends/backend_agg.py", line 203, in draw_text
self._renderer.draw_text(
OverflowError: float too large to convert
If I remember correctly, there was a similar issue when 0.53 came out.
···
--
Peter Groszkowski Gemini Observatory
Tel: +1 808 974-2509 670 N. A'ohoku Place
Fax: +1 808 935-9235 Hilo, Hawai'i 96720, USA
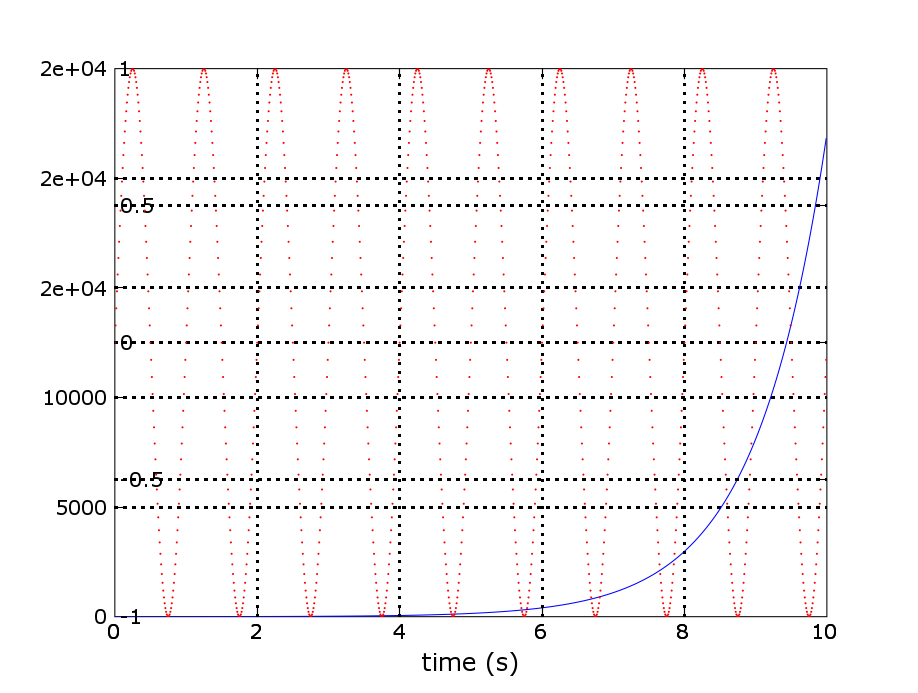
The call to tick_right() seems to produce different behaviour in 0.54.
Instead of moving the tick labels to the right of the plot, it instead
now moves the labels to just inside the left side of the plot. This it to
the right of where they were, but not nearly as useful as the original
behaviour. 
See the attached screenshot generated from two_scales.py
Otherwise, congratulations on another excellent matplotlib release!
Cheers,
Matthew.