Hello,
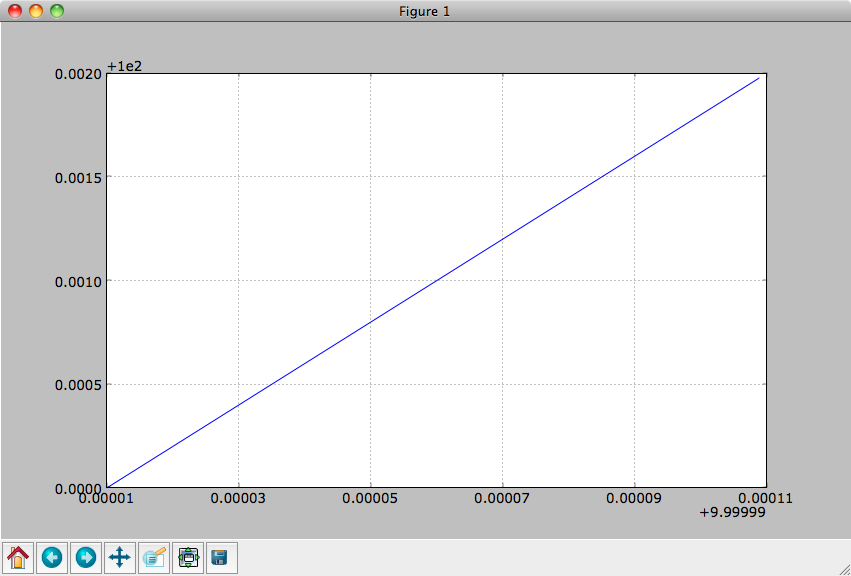
When plotting high value on a very small range (i.e. y varies from 100.000 to 100.002), matplotlib automatically removes the ‘high base value’ (here 100.000) and displays it close to the axis. (you can find enclosed my picture of this example)
The very basic thing i want to do is to disable this smart formatter, and display the values from 100.000 to 100.002.
I think it’s an easy thing to achieve, but i’m somehow lost in the jungle of instances and methods contained in the ‘plot’ library, and on top of it, i don’t know the name of this operation (‘y -= value’ only for display).
For now i’m still using matplotlib 0.99, since yet v1.0 is not available with the FINK package-manager.
Thank in advance, for your answer and your time.
Geoffroy