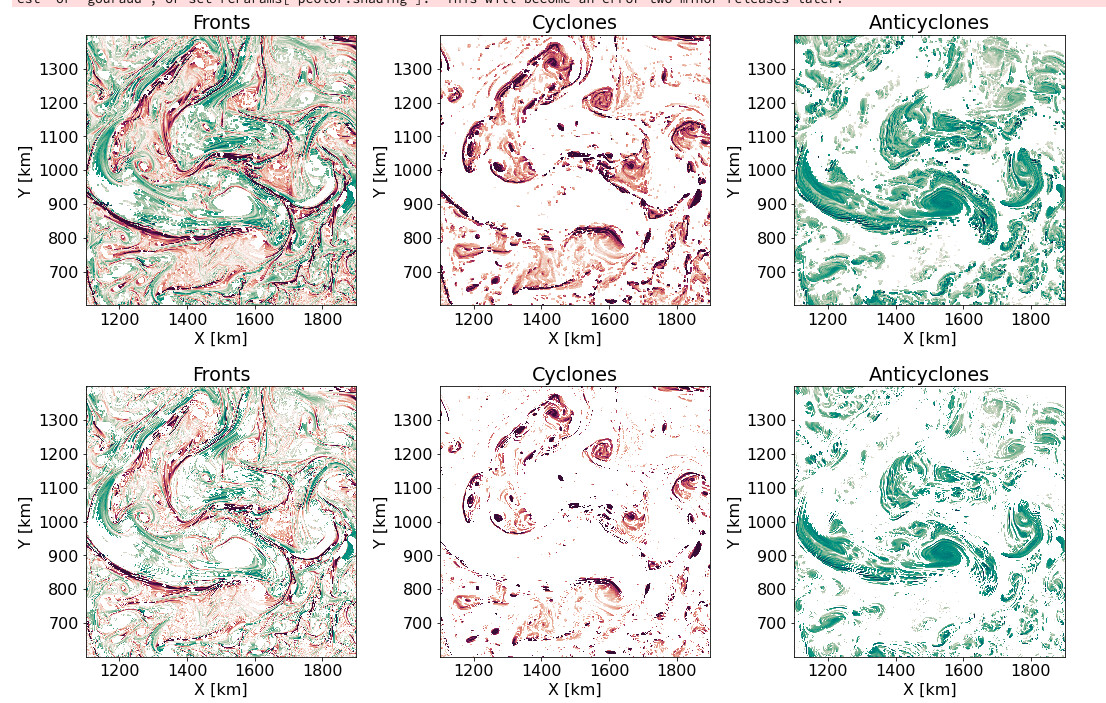
I have been trying to make some figures using pcolor and pcolormesh. The data is such that there are a lot of regions masked out (which regions in figure below).
I am attaching an example below - the top row is made using pcolormesh and bottom row using pcolor.
I noticed that pcolormesh tries to almost do some sort of smoothing/interpolation over the shorter gaps, is this to be expected? Why does pcolormesh do the smoothing? I don’t really have a question, but just want to understand why what happened happened.
Some code that was used to make this image:
ax[0,2].pcolormesh(vort_sel.XC/1000, vort_sel.YC/1000, vort_sel.where(abs(vort_sel) > abs(strain_sel)).where(vort_sel<0),
               vmin=-1., vmax=1, cmap ='cmo.curl', rasterized=True, snap=True)
ax[0,2].set_xlabel('X [km]')
ax[0,2].set_ylabel('Y [km]')
ax[0,2].set_aspect('equal')
ax[0,2].set_title('Anticyclones')

# The decomposed bits
ax[1,0].pcolor(vort_sel.XC/1000, vort_sel.YC/1000, vort_sel.where(abs(vort_sel) <= abs(strain_sel)),
               vmin=-1., vmax=1, cmap ='cmo.curl', rasterized=True, snap=True)
ax[1,0].set_xlabel('X [km]')
ax[1,0].set_ylabel('Y [km]')
ax[1,0].set_aspect('equal')
ax[1,0].set_title('Fronts')