Hello I have a Pandas dataframe as below:
value
ts
2021-02-13 11:46:00+05:30 16971.725574
2021-02-13 11:47:00+05:30 16990.962022
2021-02-13 11:48:00+05:30 17007.802479
2021-02-13 11:49:00+05:30 17016.127918
2021-02-13 11:50:00+05:30 17015.892451
… …
2021-02-13 17:40:00+05:30 13183.630007
2021-02-13 17:41:00+05:30 13184.473330
2021-02-13 17:42:00+05:30 13185.757380
2021-02-13 17:43:00+05:30 13181.779909
2021-02-13 17:44:00+05:30 13173.639479
While plotting, I get below error:
File “engine/timescaledb2.py”, line 811, in plot_graph
plt.tight_layout()
File “/opt/virtualenv/lib/python3.7/site-packages/matplotlib/cbook/deprecation.py”, line 451, in wrapper
return func(*args, **kwargs)
File “/opt/virtualenv/lib/python3.7/site-packages/matplotlib/pyplot.py”, line 1506, in tight_layout
gcf().tight_layout(pad=pad, h_pad=h_pad, w_pad=w_pad, rect=rect)
File “/opt/virtualenv/lib/python3.7/site-packages/matplotlib/cbook/deprecation.py”, line 411, in wrapper
return func(*inner_args, **inner_kwargs)
File “/opt/virtualenv/lib/python3.7/site-packages/matplotlib/figure.py”, line 2615, in tight_layout
pad=pad, h_pad=h_pad, w_pad=w_pad, rect=rect)
File “/opt/virtualenv/lib/python3.7/site-packages/matplotlib/tight_layout.py”, line 307, in get_tight_layout_figure
pad=pad, h_pad=h_pad, w_pad=w_pad)
File “/opt/virtualenv/lib/python3.7/site-packages/matplotlib/tight_layout.py”, line 84, in auto_adjust_subplotpars
bb += [ax.get_tightbbox(renderer, for_layout_only=True)]
File “/opt/virtualenv/lib/python3.7/site-packages/matplotlib/axes/_base.py”, line 4154, in get_tightbbox
renderer, for_layout_only=for_layout_only)
File “/opt/virtualenv/lib/python3.7/site-packages/matplotlib/axis.py”, line 1109, in get_tightbbox
ticks_to_draw = self._update_ticks()
File “/opt/virtualenv/lib/python3.7/site-packages/matplotlib/axis.py”, line 1022, in _update_ticks
major_labels = self.major.formatter.format_ticks(major_locs)
File “/opt/virtualenv/lib/python3.7/site-packages/matplotlib/ticker.py”, line 263, in format_ticks
return [self(value, i) for i, value in enumerate(values)]
File “/opt/virtualenv/lib/python3.7/site-packages/matplotlib/ticker.py”, line 263, in
return [self(value, i) for i, value in enumerate(values)]
File “/opt/virtualenv/lib/python3.7/site-packages/matplotlib/dates.py”, line 605, in call
return num2date(x, self.tz).strftime(self.fmt)
File “/opt/virtualenv/lib/python3.7/site-packages/matplotlib/dates.py”, line 511, in num2date
return _from_ordinalf_np_vectorized(x, tz).tolist()
File “/opt/virtualenv/lib/python3.7/site-packages/numpy/lib/function_base.py”, line 2113, in call
return self._vectorize_call(func=func, args=vargs)
File “/opt/virtualenv/lib/python3.7/site-packages/numpy/lib/function_base.py”, line 2197, in _vectorize_call
outputs = ufunc(*inputs)
File “/opt/virtualenv/lib/python3.7/site-packages/matplotlib/dates.py”, line 333, in _from_ordinalf
raise ValueError(f’Date ordinal {x} converts to {dt} (using ’
ValueError: Date ordinal 26886946 converts to 75583-12-17T00:00:00.000000 (using epoch 1970-01-01T00:00:00), but Matplotlib dates must be between year 0001 and 9999.
It appears that my index has timestamp and probably that’t the issue. But I am kind of at loss. Can you please guide me, as how to feed to plot so that the time is not lost?
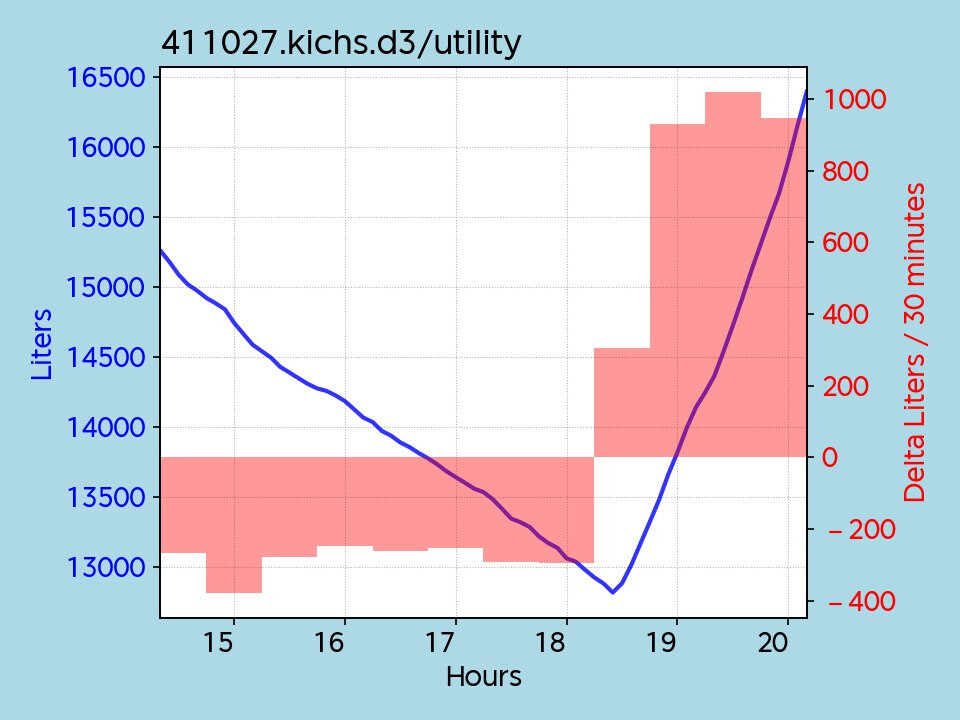
The graph that used to generate before upgrade was as below: