Hi all,
I am trying to make 3-D “curtain” plots. Basically, x,y are N-vectors, z is an M-vector, and C is MxN data set collected on the path with z. Application is a ship’s track through the ocean. I also want to be able to contour a second variable C2 also MxN. I know how to do that, but the example below just uses plot3D, because thats how I do the curtain contouring.
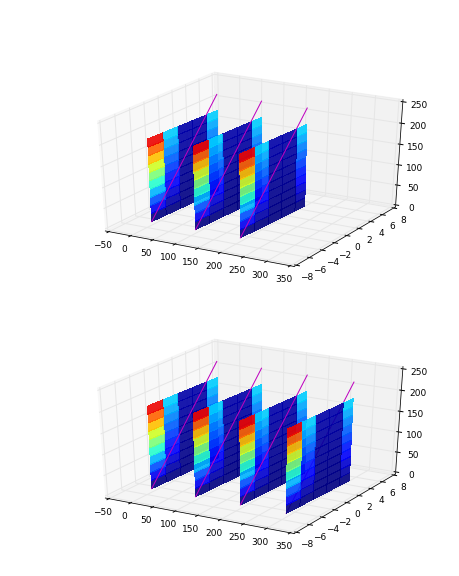
If I plot three such “curtains” they look OK, including the magenta line in each.
If I plot a fourth, the magenta line is obscured by the curtain, and so on for more curtains.
Any clue what the problem is? The code for this example is below, and I think is self contained, plus or minus running in pylab.
Thanks, Jody
from mpl_toolkits.mplot3d import Axes3D
from matplotlib import cm
import matplotlib.pyplot as plt
import numpy as np
n=0
fig = figure()
for Nn in array([3,4]):
n=n+1
ax = fig.add_subplot(2,1,n,projection=‘3d’)
for off in arange(0,Nn*2,2)*50.:
    x = np.arange(-5, 5, .5)
    y = np.arange(-5, 5, .5)
    Z = np.arange(0,200,1)
    Z=np.tile(np.reshape(Z,(200,1)),(1,size(y)))
    X = np.tile(y,(200,1))
    Y = np.tile(y,(200,1))

    N = X*Y*Z
    N = N/N.max()  # normalize 0..1
    surf = ax.plot_surface(
        X+off, Y, Z, rstride=20, cstride=4,
        facecolors=cm.jet(N),
        linewidth=0, antialiased=False, shade=False,alpha=0.9)
    ax.plot(x+off+0.001,y,(y+5)*25.,'m')
ax.set_xlim([-50,350])
ax.set_ylim([-8.,8.])
fig.savefig('doc/bad3dslices.png',res=72)
···
–
Jody Klymak
http://web.uvic.ca/~jklymak/