I am writing a final exam and I want my students to sketch a graph of
something and label the plot themselves. So, I need to create an axis
with x and y labels, but with no tick marks. This I can do, but
creating blank tick marks seems to get rid of the space where the
students would write in their own tick marks. Playing with
xtick.major.pad doesn't seem to help. What should I be doing? This
is my code:
figure(20)
clf()
xlim([0,0.1])
ylim([-10,10])
xlabel('Time (sec)')
yticks(arange(-10,11,2))#,['']*10)
ylabel(r'$v_{out}(t)$')
grid(True)
fname='blank_time_plot.eps'
outdir='figs'
ylim([-5,5])
yticks(arange(-5,5.2),['']*10)
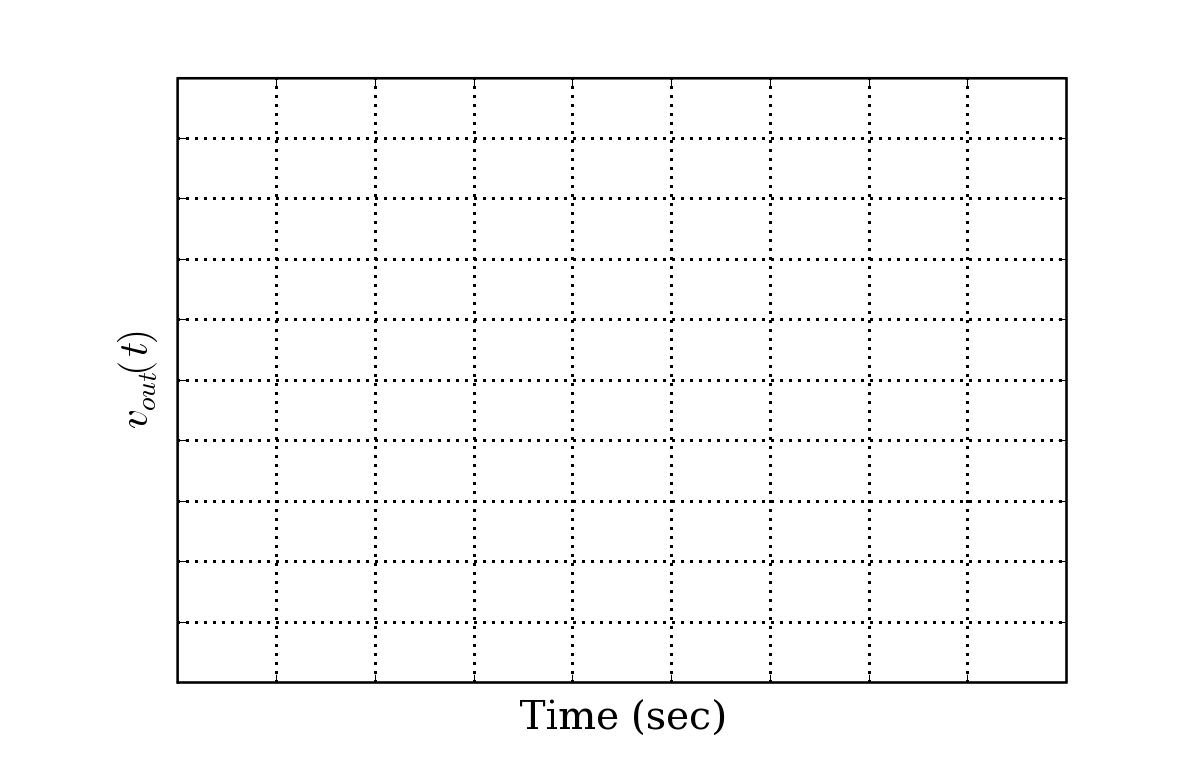
xticks(arange(1,10),['']*10)
and the result is attached (png).
Thanks,
Ryan