Greeting MPL world,
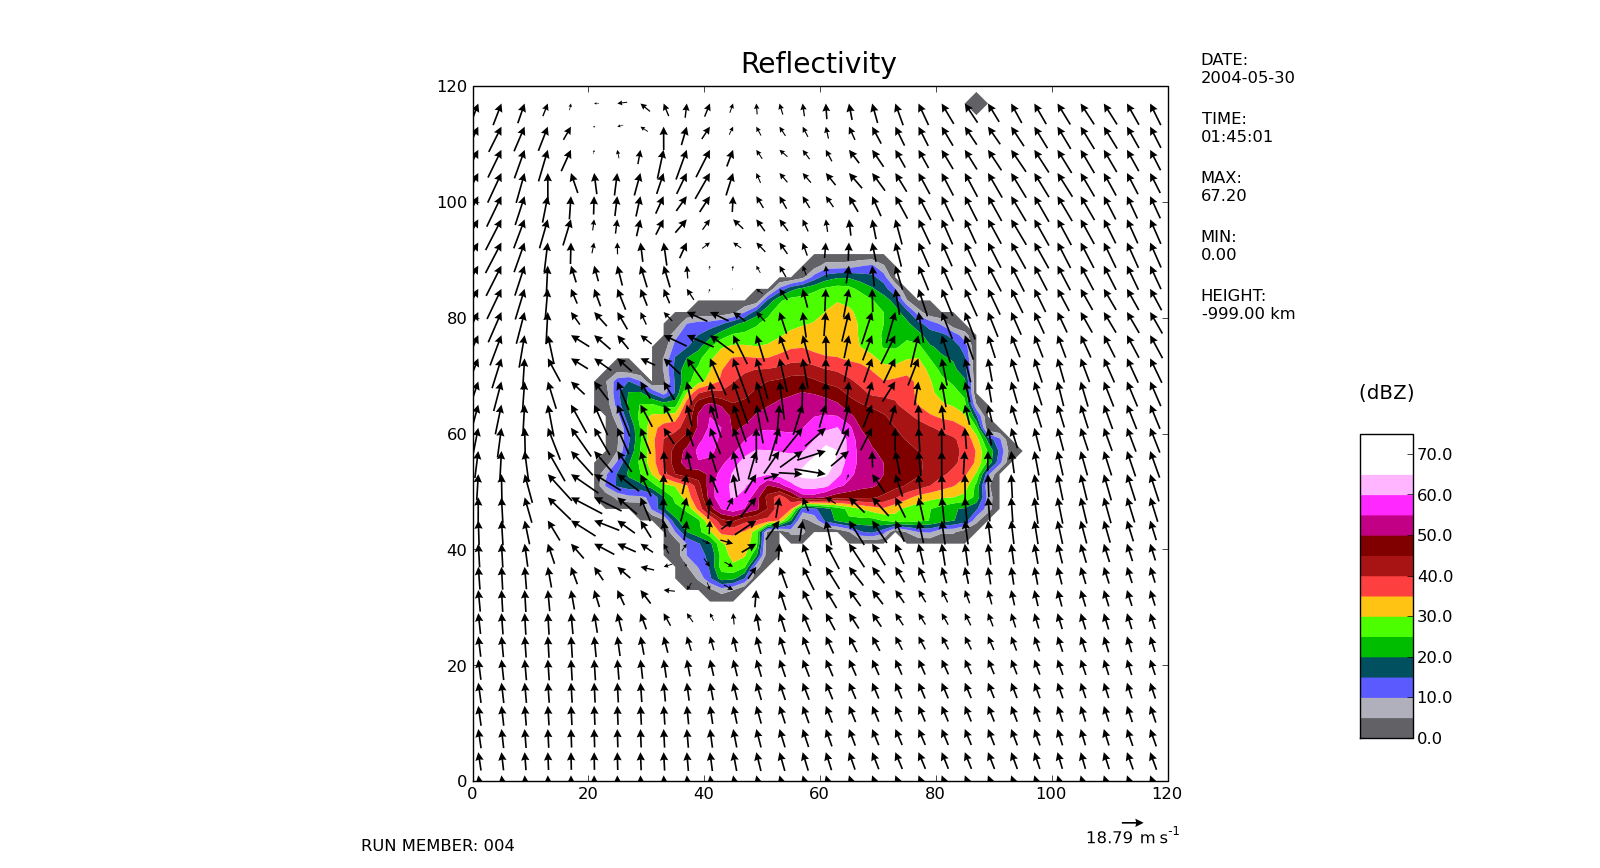
I have a contourf plot where the aspect ratio is 1. I need to add a
colorbar to the plot in a manner that keeps the colorbar in the same
place relative to the contourf plot (good.png), even if the parent
window is resized. I can do this with text, but haven't been able to
figure out how to do it with a colorbar. To the best of my knowledge,
there are two ways forward.
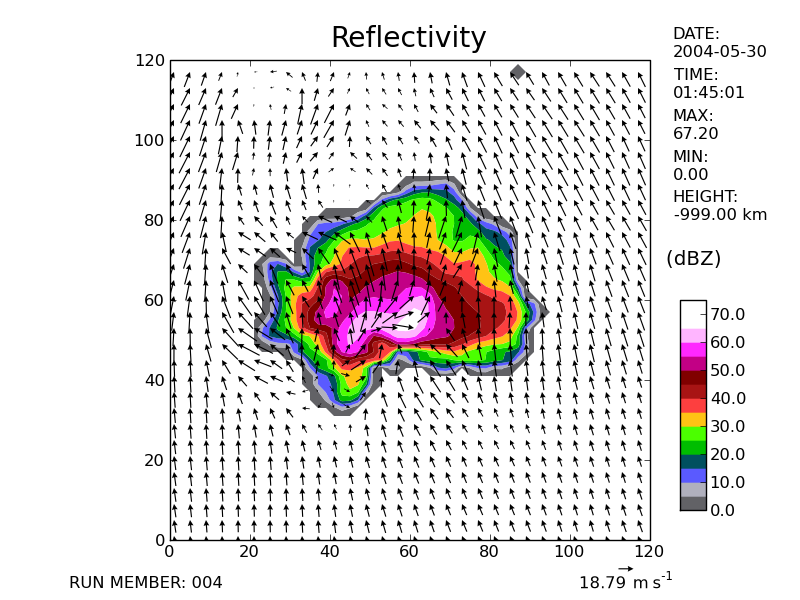
1.) I can create an entirely new axis instance (cax) but will need to
find a way to define the axes in a relative way to the original ax
instance. As it stands now, I can only define axes in terms of the
total figure size. As a result, the figure looks like it does in
bad.png
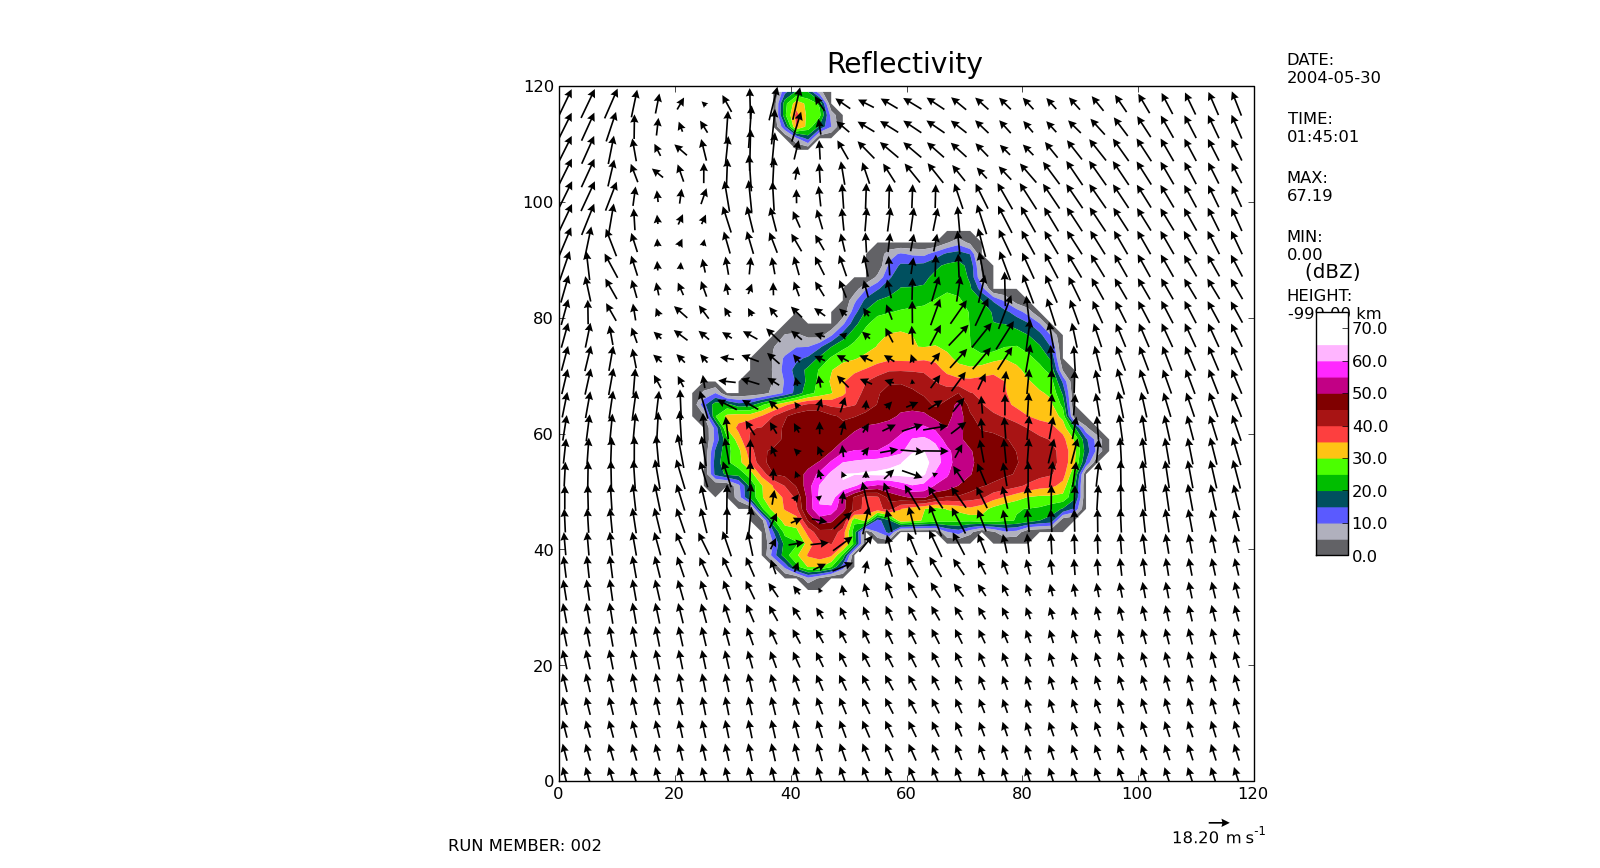
2.) I can use the original ax instance, but need to find a way to
have more control over the colorbar placement. For example, it needs
to "sit" on the x-axis and not be centered in the middle of the yaxis.
Using shrink and aspect, I can get the plot size to be correct,
however it's position is centered on the yaxis as in bad2.png
Is there a way to accomplish what I'm needing to do and I'm just missing it?
Thanks in advance,
Patrick
···
---
Patrick MarshC
Graduate Research Assistant
School of Meteorology
University of OklahomaC
http://www.patricktmarsh.com
What you need is to adjust the axes position of the colorbar at the
drawing time (because the axes position of the contour plot is
adjusted only during the drawing time).
You may do this by properly setting the axe_locator property of the axes.
If you're using mpl 0.99, axes_grid toolkit may be helpful.
I just posted a simple example with the screenshot in the link below.
Regards,
-JJ
···
On Sat, Aug 22, 2009 at 9:51 PM, Patrick Marsh<patrickmarshwx@...287...> wrote:
Greeting MPL world,
I have a contourf plot where the aspect ratio is 1. I need to add a
colorbar to the plot in a manner that keeps the colorbar in the same
place relative to the contourf plot (good.png), even if the parent
window is resized. I can do this with text, but haven't been able to
figure out how to do it with a colorbar. To the best of my knowledge,
there are two ways forward.
1.) I can create an entirely new axis instance (cax) but will need to
find a way to define the axes in a relative way to the original ax
instance. As it stands now, I can only define axes in terms of the
total figure size. As a result, the figure looks like it does in
bad.png
2.) I can use the original ax instance, but need to find a way to
have more control over the colorbar placement. For example, it needs
to "sit" on the x-axis and not be centered in the middle of the yaxis.
Using shrink and aspect, I can get the plot size to be correct,
however it's position is centered on the yaxis as in bad2.png
Is there a way to accomplish what I'm needing to do and I'm just missing it?
Thanks in advance,
Patrick
---
Patrick MarshC
Graduate Research Assistant
School of Meteorology
University of OklahomaC
http://www.patricktmarsh.com
------------------------------------------------------------------------------
Let Crystal Reports handle the reporting - Free Crystal Reports 2008 30-Day
trial. Simplify your report design, integration and deployment - and focus on
what you do best, core application coding. Discover what's new with
Crystal Reports now. http://p.sf.net/sfu/bobj-july
_______________________________________________
Matplotlib-users mailing list
Matplotlib-users@lists.sourceforge.net
matplotlib-users List Signup and Options
Hi JJ,
I'm not sure I understand how to properly set the axe_locator. Below
is my snippet of code that I use to create my contourf plot and then
create the colorbar. I'm unsure how I would modify it to do as you
suggested. Any help would be appreciated.
plot = ax.contourf(xc, yc, data, cmap=cmap, levels=clevels)
cax = plt.axes([0.85, 0.125, 0.035, 0.325])
cbar = fig.colorbar(plot, format='%.1f', cax=cax)
I should also point out that the reason I'm not using the axes_grid
toolkit is because I'm constrained to develop based on the current
Enthought release.
Patrick
···
---
Patrick Marsh
Graduate Research Assistant
School of Meteorology
University of Oklahoma
http://www.patricktmarsh.com
On Sat, Aug 22, 2009 at 10:37 PM, Jae-Joon Lee<lee.j.joon@...287...> wrote:
What you need is to adjust the axes position of the colorbar at the
drawing time (because the axes position of the contour plot is
adjusted only during the drawing time).
You may do this by properly setting the axe_locator property of the axes.
If you're using mpl 0.99, axes_grid toolkit may be helpful.
I just posted a simple example with the screenshot in the link below.
A Little Bit of Python, A Little Bit of Astronomy: Creating a color bar using inset axes
Regards,
-JJ
On Sat, Aug 22, 2009 at 9:51 PM, Patrick Marsh<patrickmarshwx@...287...> wrote:
Greeting MPL world,
I have a contourf plot where the aspect ratio is 1. I need to add a
colorbar to the plot in a manner that keeps the colorbar in the same
place relative to the contourf plot (good.png), even if the parent
window is resized. I can do this with text, but haven't been able to
figure out how to do it with a colorbar. To the best of my knowledge,
there are two ways forward.
1.) I can create an entirely new axis instance (cax) but will need to
find a way to define the axes in a relative way to the original ax
instance. As it stands now, I can only define axes in terms of the
total figure size. As a result, the figure looks like it does in
bad.png
2.) I can use the original ax instance, but need to find a way to
have more control over the colorbar placement. For example, it needs
to "sit" on the x-axis and not be centered in the middle of the yaxis.
Using shrink and aspect, I can get the plot size to be correct,
however it's position is centered on the yaxis as in bad2.png
Is there a way to accomplish what I'm needing to do and I'm just missing it?
Thanks in advance,
Patrick
---
Patrick MarshC
Graduate Research Assistant
School of Meteorology
University of OklahomaC
http://www.patricktmarsh.com
------------------------------------------------------------------------------
Let Crystal Reports handle the reporting - Free Crystal Reports 2008 30-Day
trial. Simplify your report design, integration and deployment - and focus on
what you do best, core application coding. Discover what's new with
Crystal Reports now. http://p.sf.net/sfu/bobj-july
_______________________________________________
Matplotlib-users mailing list
Matplotlib-users@lists.sourceforge.net
matplotlib-users List Signup and Options
I think you can just copy the axes_grid.inset_locator.py file and use
it after deleting a few lines of code that gives some ImportError.
However, here is a some related post.
http://www.nabble.com/embedding-figures-inside-another-(coordinates)-td22826126.html#a22832238
Just replace the bbox coordinate of the inset axes, eg.,
ip = InsetPosition(ax, [1.1, 0., 0.1, 0.5])
Note that the coordinate is the normalized axes coordinate of the parent axes.
*axes_locator* takes a callable object which takes arguments of the
axes itself and the renderer, and subsequently returns the bbox
object. Once set, the axes_locator is called at the drawing time and
adjust the axes position to the returned bbox.
-JJ
···
On Sun, Aug 23, 2009 at 10:42 AM, Patrick Marsh<patrickmarshwx@...287...> wrote:
Hi JJ,
I'm not sure I understand how to properly set the axe_locator. Below
is my snippet of code that I use to create my contourf plot and then
create the colorbar. I'm unsure how I would modify it to do as you
suggested. Any help would be appreciated.
   plot = ax\.contourf\(xc, yc, data, cmap=cmap, levels=clevels\)
   cax = plt\.axes\(\[0\.85, 0\.125, 0\.035, 0\.325\]\)
   cbar = fig\.colorbar\(plot, format='%\.1f', cax=cax\)
I should also point out that the reason I'm not using the axes_grid
toolkit is because I'm constrained to develop based on the current
Enthought release.
Patrick
---
Patrick Marsh
Graduate Research Assistant
School of Meteorology
University of Oklahoma
http://www.patricktmarsh.com
On Sat, Aug 22, 2009 at 10:37 PM, Jae-Joon Lee<lee.j.joon@...287...> wrote:
What you need is to adjust the axes position of the colorbar at the
drawing time (because the axes position of the contour plot is
adjusted only during the drawing time).
You may do this by properly setting the axe_locator property of the axes.
If you're using mpl 0.99, axes_grid toolkit may be helpful.
I just posted a simple example with the screenshot in the link below.
A Little Bit of Python, A Little Bit of Astronomy: Creating a color bar using inset axes
Regards,
-JJ
On Sat, Aug 22, 2009 at 9:51 PM, Patrick Marsh<patrickmarshwx@...287...> wrote:
Greeting MPL world,
I have a contourf plot where the aspect ratio is 1. I need to add a
colorbar to the plot in a manner that keeps the colorbar in the same
place relative to the contourf plot (good.png), even if the parent
window is resized. I can do this with text, but haven't been able to
figure out how to do it with a colorbar. To the best of my knowledge,
there are two ways forward.
1.) I can create an entirely new axis instance (cax) but will need to
find a way to define the axes in a relative way to the original ax
instance. As it stands now, I can only define axes in terms of the
total figure size. As a result, the figure looks like it does in
bad.png
2.) I can use the original ax instance, but need to find a way to
have more control over the colorbar placement. For example, it needs
to "sit" on the x-axis and not be centered in the middle of the yaxis.
Using shrink and aspect, I can get the plot size to be correct,
however it's position is centered on the yaxis as in bad2.png
Is there a way to accomplish what I'm needing to do and I'm just missing it?
Thanks in advance,
Patrick
---
Patrick MarshC
Graduate Research Assistant
School of Meteorology
University of OklahomaC
http://www.patricktmarsh.com
------------------------------------------------------------------------------
Let Crystal Reports handle the reporting - Free Crystal Reports 2008 30-Day
trial. Simplify your report design, integration and deployment - and focus on
what you do best, core application coding. Discover what's new with
Crystal Reports now. http://p.sf.net/sfu/bobj-july
_______________________________________________
Matplotlib-users mailing list
Matplotlib-users@lists.sourceforge.net
matplotlib-users List Signup and Options