Hi!
Matplotlib is great! (For some unknown reason Matplotlib did not work until I finally bought a differnt Windows XP computer).
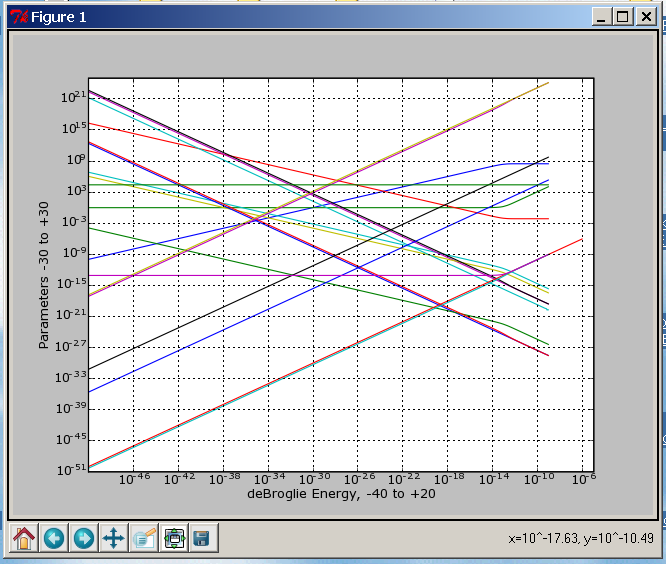
Finally after about a year of trying, I can plot! but when the figure is on screen, how can I quickly grab it and save it to a png file? Attached is a picture of my plot.
This picture was saved using a free screen saver called "Fastone Screen Saver." It is really neat! When you start it, a small floating tool bar is on screen. Click on the capture rectangle option, and the cross hairs allow getting your plotted figure. Now your mouse wheel button allows you to enlarge or make the captured figure as small or as large as you like. You are given the option to save it to a folder as a .png file.
Incidentaly, I need to be able to find a way to increase the precision of Python but only while using an equation (or function?) that calculates gamma (g), which is part of the script that generates the lists that are plotted. Code below is a small part of the calculation and plotting statements required for generating the 42 parameter arrays [lists].
Solve the quadratic, with successive energies as inputs from each kth element.
and solve for gamma = g = 1/(1-v**2/LightSpeed**2)**0.5
This is where the greater precision is needed,
when veleocity v is very nearly equal to LightSpeed.
LightSpeed = 299792458.00000000 # Meter/Second
m0 = 9.109389700e-31 # Kilogram Mass Electron
h = 6.62607549351e-034 # h = Q0**2*Z0/(2*a) # Planck's Constant
# SOLVE FOR ALL PARAMETERS
k = 0
while k<541: # Get each kth deBroglie energy
Ed = Ed_data541[k] # (deBroglie Energy array X-Axis data)
f = Ed/h
# -----------------------------------------------------------------
# ----------------# Solve Quadratic (V = v**2)
A = 1.0 # Quadratic Coefficient A
B =(h*f/(m0*LightSpeed))**2 # Quadratic Coefficient B
C = -(h*f/m0)**2 # Quadratic Coefficient C
V = (-B +(B**2-4*A*C)**0.5)/(2*A)
v = V**0.5 # Find Velocity from square root of v**2
b = v/C
Ev = Ed/Q0 # Electron Volt Energy
print Ed,k,g,v,C,b,Ev," Ed, k, g, v, LightSpeed, b, Ev"
if v > LightSpeed:
break
if v < C:
g = 1/(1.0-(v**2/C**2))**0.5 # Gamma
# ---------------------------------------------------------------
# Calculate statements for 42 parameters, and to fill 42 arrays
k = k+1
# Plot statements
In Python, double precision is already used,
how can a better precision be invoked for this code only?
Can it be done by in-line code or is a function needed?
Hubert Fitch
···
----- Original Message ----- From: "CL" <anewgene@...287...>
To: <matplotlib-users@lists.sourceforge.net>
Sent: Thursday, August 17, 2006 2:16 AM
Subject: [Matplotlib-users] copy to graph to clipboard
Hi,
When matplotlib is used interactively, eg, with ipython, I find
that it will be convenient if I can copy the graph into clipboard and
then paste it to other program. But this feature is missed in current
release. Is there a plan to add this functionality in a future release?
If possible, adding a print/preview button will be useful too.Many thanks for developers' great work.
Chunlei
-------------------------------------------------------------------------
Using Tomcat but need to do more? Need to support web services, security?
Get stuff done quickly with pre-integrated technology to make your job easier
Download IBM WebSphere Application Server v.1.0.1 based on Apache Geronimo
http://sel.as-us.falkag.net/sel?cmd=lnk&kid=120709&bid=263057&dat=121642
_______________________________________________
Matplotlib-users mailing list
Matplotlib-users@lists.sourceforge.net
matplotlib-users List Signup and Options