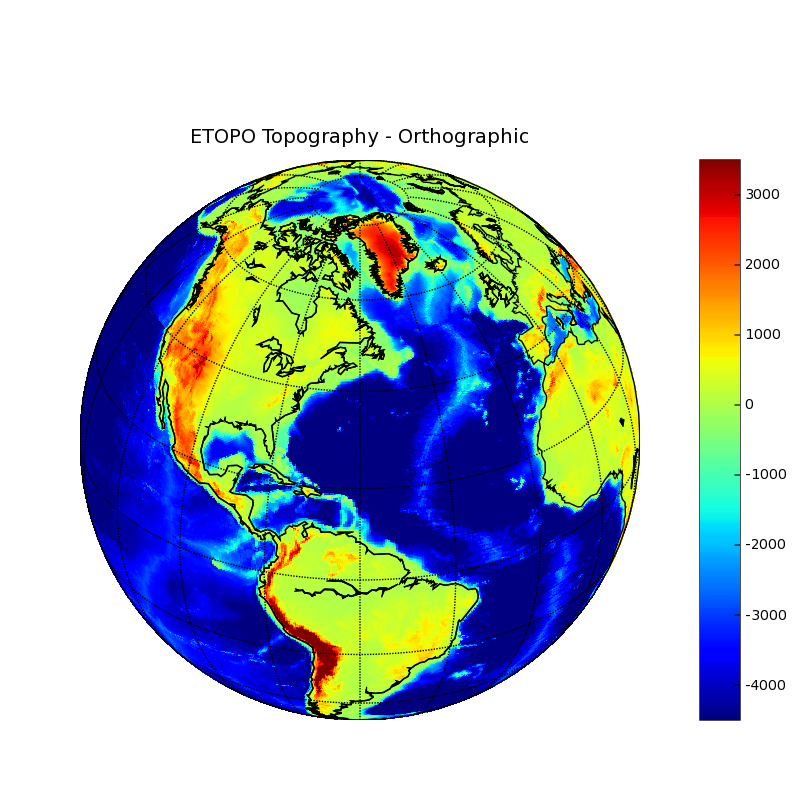
I just added the orthographic projection to the basemap toolkit - you can now make really nifty pseudo-satellite views of global data.
Here's an example:
http://www.cdc.noaa.gov/people/jeffrey.s.whitaker/ortho.png
This was generated using pcolor by the plotmap_ortho.py example script now in CVS. It requires the pcolor masked-array patch I sent to the matplotlib-devel list this morning. For some reason, pylab.contour goes berserk when you try to contour data on this projection - I;m still working on that.
-Jeff
···
--
Jeffrey S. Whitaker Phone : (303)497-6313
Meteorologist FAX : (303)497-6449
NOAA/OAR/CDC R/CDC1 Email : Jeffrey.S.Whitaker@...259...
325 Broadway Office : Skaggs Research Cntr 1D-124
Boulder, CO, USA 80303-3328 Web : http://tinyurl.com/5telg
Jeff,
That is slick! You're using PROJ4, right? I'm happy to see a working application of orthographic projection. We need to talk sometime about how to hook pylab up to GIS data through GDAL/OGR or to web services using WMS/WFS.
cheers,
Sean
···
On May 13, 2005, at 1:26 PM, Jeff Whitaker wrote:
I just added the orthographic projection to the basemap toolkit - you can now make really nifty pseudo-satellite views of global data.
Here's an example:
http://www.cdc.noaa.gov/people/jeffrey.s.whitaker/ortho.png
This was generated using pcolor by the plotmap_ortho.py example script now in CVS. It requires the pcolor masked-array patch I sent to the matplotlib-devel list this morning. For some reason, pylab.contour goes berserk when you try to contour data on this projection - I;m still working on that.
-Jeff
--
Sean Gillies
sgillies at frii dot com
http://zcologia.com
Very cool!
At some point in the future we'll be interested in modifying/extending the basemap module to allow other data sets. In particular, we're going to need to do maps of Mars using the Mars laser altimeter database (MOLA).
I wonder if the ability use GIS data sets could be worked in at the same time using some type of common architecture?
Ted
···
At 12:34 PM 5/13/2005, Sean Gillies wrote:
On May 13, 2005, at 1:26 PM, Jeff Whitaker wrote:
I just added the orthographic projection to the basemap toolkit - you can now make really nifty pseudo-satellite views of global data.
Here's an example:
http://www.cdc.noaa.gov/people/jeffrey.s.whitaker/ortho.png
This was generated using pcolor by the plotmap_ortho.py example script now in CVS. It requires the pcolor masked-array patch I sent to the matplotlib-devel list this morning. For some reason, pylab.contour goes berserk when you try to contour data on this projection - I;m still working on that.
-Jeff
Jeff,
That is slick! You're using PROJ4, right? I'm happy to see a working application of orthographic projection. We need to talk sometime about how to hook pylab up to GIS data through GDAL/OGR or to web services using WMS/WFS.
cheers,
Sean
--
Sean Gillies
sgillies at frii dot com
http://zcologia.com
-------------------------------------------------------
This SF.Net email is sponsored by Oracle Space Sweepstakes
Want to be the first software developer in space?
Enter now for the Oracle Space Sweepstakes!
http://ads.osdn.com/?ad_id=7393&alloc_id=16281&op=click
_______________________________________________
Matplotlib-users mailing list
Matplotlib-users@lists.sourceforge.net
matplotlib-users List Signup and Options
Ted,
You mean to do stuff like this: http://zcologia.net/files/mars_topo.jpg ? 
I simply downloaded the most coarse MOLA topography, read it with GDAL, and warped it to an orthographic projection (0 latitude, 0 longitude). GDAL has a SWIG-generated Python module that could be used from pylab. The recipe for this example is at zcologia.com.
cheers,
Sean
···
On May 13, 2005, at 5:27 PM, Ted Drain wrote:
Very cool!
At some point in the future we'll be interested in modifying/extending the basemap module to allow other data sets. In particular, we're going to need to do maps of Mars using the Mars laser altimeter database (MOLA).
PDS Geosciences Node Data and Services: MGS MOLA MEGDRs
I wonder if the ability use GIS data sets could be worked in at the same time using some type of common architecture?
Ted
At 12:34 PM 5/13/2005, Sean Gillies wrote:
On May 13, 2005, at 1:26 PM, Jeff Whitaker wrote:
I just added the orthographic projection to the basemap toolkit - you can now make really nifty pseudo-satellite views of global data.
Here's an example:
http://www.cdc.noaa.gov/people/jeffrey.s.whitaker/ortho.png
This was generated using pcolor by the plotmap_ortho.py example script now in CVS. It requires the pcolor masked-array patch I sent to the matplotlib-devel list this morning. For some reason, pylab.contour goes berserk when you try to contour data on this projection - I;m still working on that.
-Jeff
Jeff,
That is slick! You're using PROJ4, right? I'm happy to see a working application of orthographic projection. We need to talk sometime about how to hook pylab up to GIS data through GDAL/OGR or to web services using WMS/WFS.
cheers,
Sean
--
--
Sean Gillies
sgillies at frii dot com
http://zcologia.com