On Fri, Sep 2, 2011 at 11:28 PM, R. O'Gara <ronogara@...9...> wrote:
Jae-Joon, thanks for your reply.
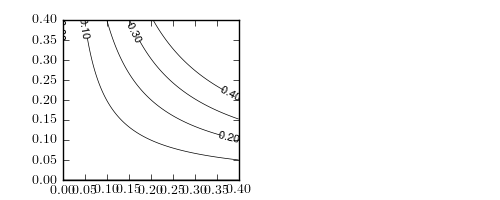
There is a combination of effects that make my contour labels placed in unfortunate positions. Here is a self-contained example (somewhat different from issue I originally explained, but illustrates the fact clabels are not where I'd like them to be)
import numpy as np
import matplotlib as mpl
ff = 10
params = {
'text.usetex': True,
'axes.labelsize': ff,
'axes.fontsize': ff,
'legend.fontsize' : ff,
'xtick.labelsize' : ff,
'ytick.labelsize' : ff,
'figure.dpi': 150,
'figure.figsize' : [5,2],
}
mpl.rcParams.update(params)
import matplotlib.pyplot as plt
import matplotlib.gridspec as gridspec
gs = gridspec.GridSpec(1,2)
ax = plt.subplot(gs[0])
xi = np.linspace(0,0.4,100)
yi = np.linspace(0,0.4,100)
xx,yy = np.meshgrid(xi,yi)
zi = np.sin(5*xx*yy)
v = np.arange(0.0, 0.5, 0.1)
cplot = ax.contour(xi, yi, zi, v, linewidths=0.5, colors='k')
ax.clabel(cplot, v,
fontsize = 8,
inline=True,
fmt = "%0.2f",
)
ax.axis([np.min(xi),np.max(xi),np.min(yi),np.max(yi)])
plt.show()
The end result is that contour labels are placed almost outside of the grid, with most of the area in the center being blank. I am pretty sure it has to do with the way rcParams are set, but I have no idea why. Params I do need to set are text.usetex, figure.dpi, and figure.figsize. I am using matplotlib 1.0.1.
Thanks for your help,
----- Original Message -----
From: Jae-Joon Lee <lee.j.joon@...287...>
To: R. O'Gara <ronogara@...9...>
Cc: "matplotlib-users@lists.sourceforge.net" <matplotlib-users@...1544...ceforge.net>
Sent: Monday, August 22, 2011 11:56 PM
Subject: Re: [Matplotlib-users] contour's clabels overlap each other in an ImageGrid
Can you post an simple self-contained script that reproduces your problem?
I just tried something similar but could not reproduces your problem.
Here is what I did,
Also, what version of matplotlb are you using?
Regards,
-JJ
import matplotlib.pyplot as plt
import numpy as np
from mpl_toolkits.axes_grid1 import ImageGrid
fig = plt.figure(1)
arr = np.arange(100).reshape((10, 10))
grid = ImageGrid(fig, 111, (2, 2))
cntr0 = grid[0].contour(arr)
cntr1 = grid[1].contour(arr)
cntr2 = grid[2].contour(arr)
cntr3 = grid[3].contour(arr)
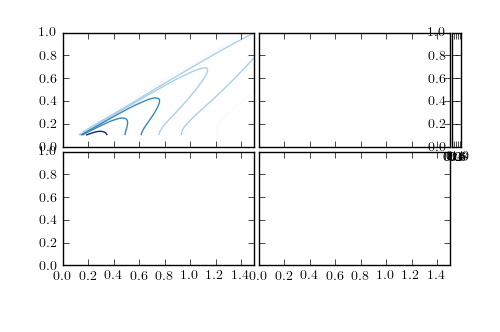
plt.clabel(cntr0, manual=True)
plt.clabel(cntr1, manual=True)
plt.clabel(cntr2, manual=True)
plt.clabel(cntr3, manual=True)
On Thu, Aug 18, 2011 at 1:10 PM, R. O'Gara <ronogara@...9...> wrote:
Hey guys,
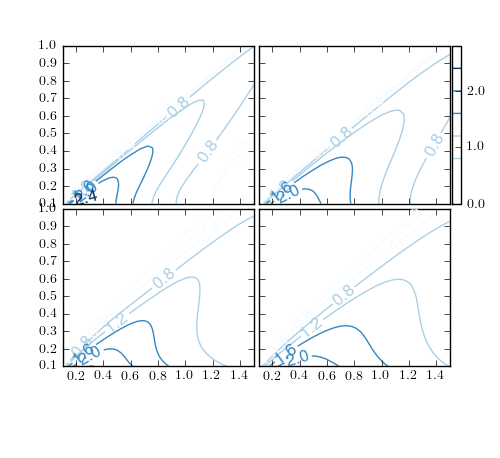
I was hoping someone could provide a hint for how I should go about correcting this. As you can see, locations for the inline labels for
contours in this image are unfortunately chosen, and they overlap with one another. If I set manual to 'True' then I get this weird behavior
where I can only choose labels in the top left grid and nothing is shownin any of the other grids.
I am using a 2x2 Image Grid (I get the same problem when using gridspec instead of image grid), and loadingcontour data (2x2 array) from a file.
Thanks for your help,
Ron
------------------------------------------------------------------------------
Get a FREE DOWNLOAD! and learn more about uberSVN rich system,
user administration capabilities and model configuration. Take
the hassle out of deploying and managing Subversion and the
tools developers use with it. http://p.sf.net/sfu/wandisco-d2d-2
_______________________________________________
Matplotlib-users mailing list
Matplotlib-users@lists.sourceforge.net
matplotlib-users List Signup and Options