Friends,
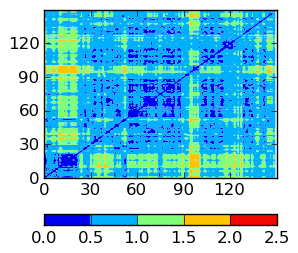
I have a matrix (attached data) and the values in the matrix ranges from 0 to 2.2. I used the following scrip to create a contourf plot by giving the levels (0 to 2.5 at intervals of 0.5) and colors. This has produced the attached figure. My questions are follows
- When i set the levels and colors (as in the pasted mpl script below), contourf produced the attached figure using the discrete colors i specified for each intervals. The document for norm arguement under contouf says ‘instance for
scaling data values to colors’. What does this scaling exactly mean ?. I want to try this scaling but i dnt know how to include this in my script. - How to use the set_over and set_under options for colorbar ?
**My script
test_data (110 KB)
···
#!/usr/bin/env python
import matplotlib.pyplot as plt
from sys import argv
import numpy as np
M1=np.loadtxt(argv[1])
levs=[0,0.5,1,1.5,2.0,2.5]
col=[‘blue’,’#6495ed’,’#bebebe’,’#00ff00’,‘red’]
FIG=plt.figure(figsize=(3,3))
ax1=FIG.add_subplot(1,1,1)
cont=ax1.contourf(M1,linestyles=‘solid’,levels=levs,colors=col)
ax1.set_xlim([0,150])
ax1.set_xticks(range(0,150,30))
ax1.set_ylim([0,150])
ax1.set_yticks(range(0,150,30))
plt.colorbar(cont,orientation=‘horizontal’)
plt.savefig(‘test.png’,dpi=100,bbox_inches=‘tight’)**