Friends,
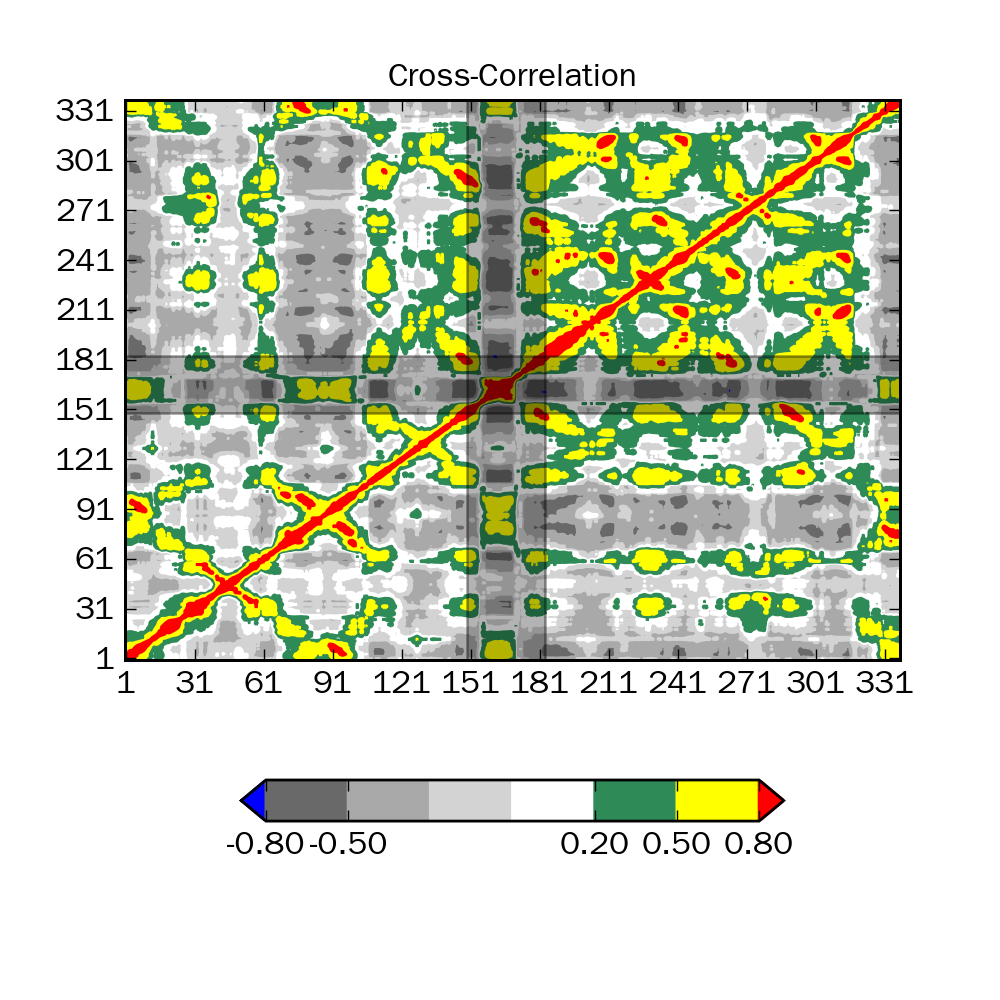
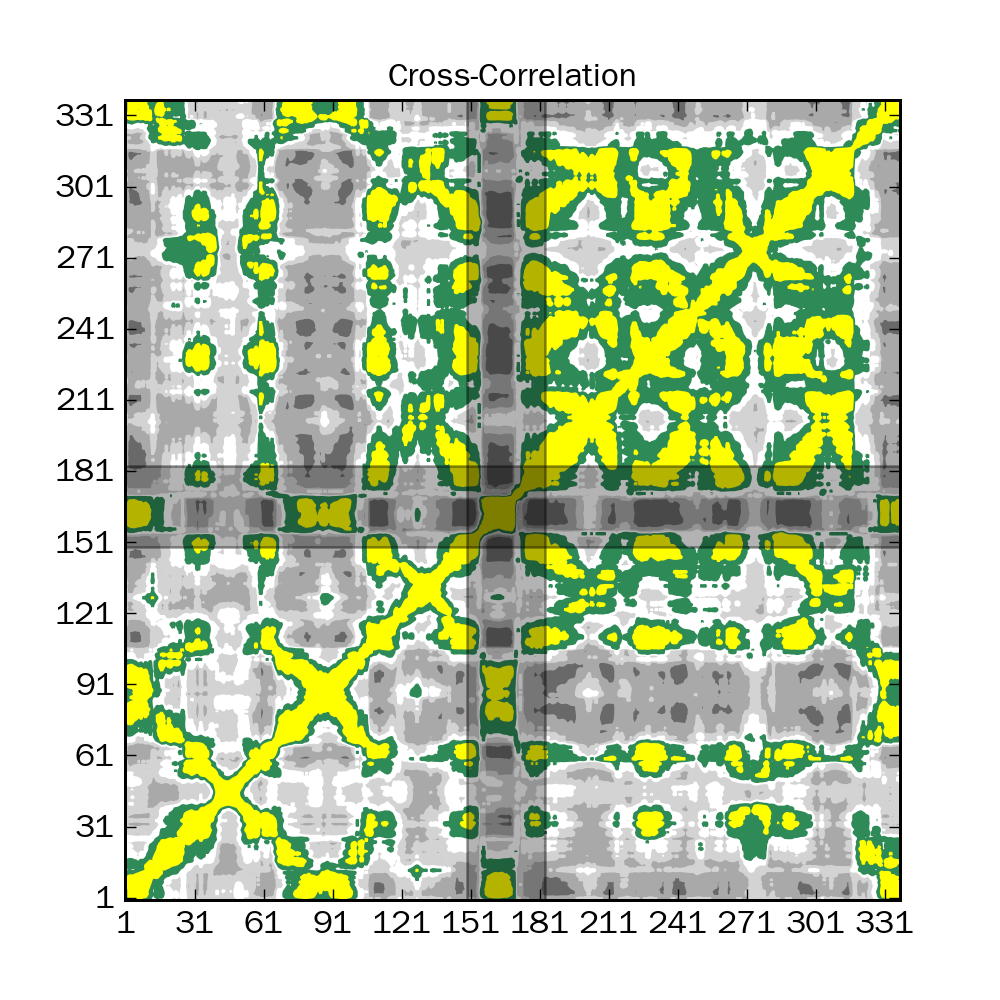
I wrote a small program to plot a matrix using contourf function. The code is pasted below. The image that is created is attached (1.png). Now if i make the same figure, just by omitting the colorbar by commenting the line, then i see that the contourf output is different (2.png). Why this difference ? Whether i include colorbar or not, the contourf should create similar plot right ?. Am i wrong something wrong in the code. Kindly help me to understand the problem.
CODE
#!/usr/bin/env python
USAGE: python script matrix-file
import matplotlib.pyplot as plt
import matplotlib.colors as clr
import numpy as np
from sys import argv
import matplotlib as mpl
# Assignments
inmat=np.loadtxt(argv[1])
mpl.rcParams[‘font.family’]=‘bold’
mpl.rcParams[‘font.size’]=12.0
FIG=plt.figure(figsize=(5,5))
ax1 = FIG.add_subplot(111)
ax1.set_title(‘Cross-Correlation’,size=12,fontweight=‘bold’)
ax1.set_xlim(auto=True)
ax1.set_ylim(auto=True)
ax1.set_xticks(range(1,len(inmat),30))
ax1.set_yticks(range(1,len(inmat),30))
ax1.axvspan(149,183,facecolor=‘black’,alpha=0.3)
ax1.axhspan(149,183,facecolor=‘black’,alpha=0.3)
lev=[-0.8,-0.5,-0.2,0,0.2,0.5,0.8]
col=[’#696969’,’#a9a9a9’,’#d3d3d3’,’#ffffff’,’#2e8b57’,’#ffff00’]
# Define color map
cmap=clr.ListedColormap(col)
norm=clr.BoundaryNorm(lev, cmap.N)
# Make the contourf
CNF=ax1.contourf(inmat,cmap=cmap,norm=norm,levels=lev,origin=‘lower’,extend=‘both’)
CNF.cmap.set_under(‘blue’)
CNF.cmap.set_over(‘red’)
# set up colorbar
#plt.colorbar(CNF,ticks=[-0.8,-0.5,0.2,0.5,0.8],shrink=0.7,format="%.2f",orientation=‘horizontal’,aspect=12)
plt.savefig(‘img.png’,dpi=200)