is there any more information you'd like to help me with constructing a legend for this scatter?
i think i am misusing the scatter graph here... letting scatter assign colours from a continous selection rather than specifying a color.
please help,
jack
I could guess at what you are trying to do, but it would help a lot if you posted an example that we could run, with comments about what you want to happen versus what is happening.
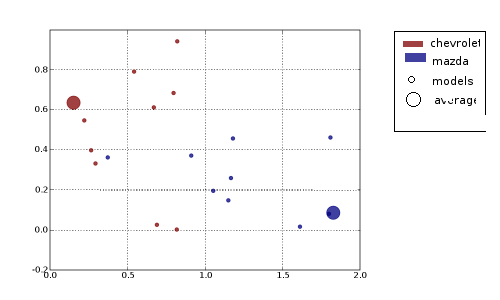
thanks... attached is an image of roughly what i want. a program is below.
#!/usr/bin/python
from pylab import *
N=20
def xycs():
x,y=resize(rand(2*N),(2,N))
x[:N/2]*=2;y[:N/2]/=2;
c=array([0]*(N/2)+[1]*(N/2))
s=array(([400]+[30]*(N/2-1))*2)
print zip(c,s)
p=scatter(x,y,c=c,s=s,faceted=0)
grid(True)
setp(p, 'alpha', 0.75)
savefig('scat_lgnd.png')
show()
return 0
if __name__=='__main__':
xycs()
---- _I v o r y__K i t e____
jack andrews
university of mordialloc
vic australia effbiae@...637...
···
On 03/09/05 14:22:33, Jack Andrews wrote: