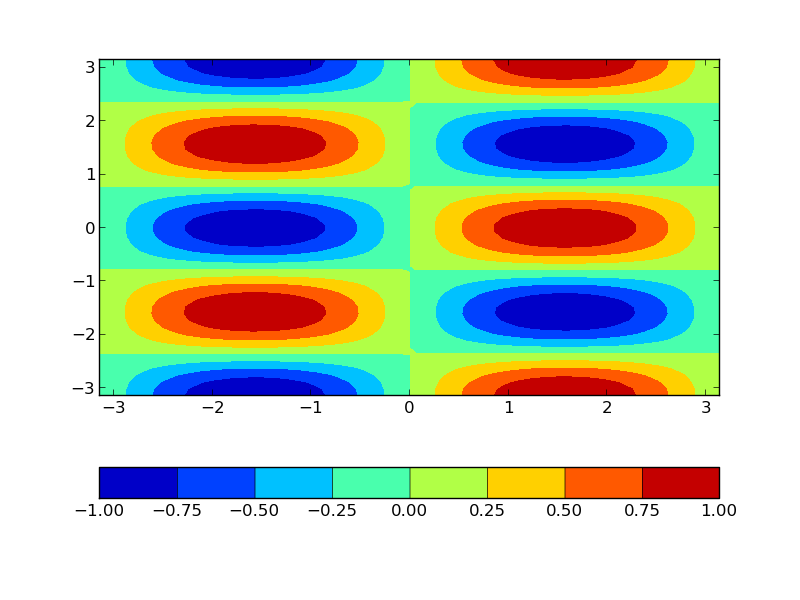
I just noticed that colorbar edges are drawn in white when output in PDF and black when output in PNG. A small test script is attached along with the output to show the difference.
I’d be interested in knowing if others can reproduce this? I’m using mpl-1.3.x (updated 5 minutes ago) on 64-bit Ubuntu 12.04.
I just noticed that colorbar edges are drawn in white when output in PDF and black when output in PNG. A small test script is attached along with the output to show the difference.
I'd be interested in knowing if others can reproduce this? I'm using mpl-1.3.x (updated 5 minutes ago) on 64-bit Ubuntu 12.04.
Perhaps Michael could weigh in on this? Or others familiar with backend workings?
Andrew
···
On 31 October 2012 16:29, Nicolas Rougier <Nicolas.Rougier@…922…> wrote:
I confirm on 1.2.x. on OSX 10.7.5.
Nicolas
On Oct 31, 2012, at 17:20 , Andrew Dawson wrote:
Hi all,
I just noticed that colorbar edges are drawn in white when output in PDF and black when output in PNG. A small test script is attached along with the output to show the difference.
I’d be interested in knowing if others can reproduce this? I’m using mpl-1.3.x (updated 5 minutes ago) on 64-bit Ubuntu 12.04.
I just noticed that colorbar edges are drawn in white when output in PDF and black when output in PNG. A small test script is attached along with the output to show the difference.
I'd be interested in knowing if others can reproduce this? I'm using mpl-1.3.x (updated 5 minutes ago) on 64-bit Ubuntu 12.04.
Cheers,
Andrew
bug.py
import matplotlib.pyplot as plt
import numpy as np
# dummy data
x = y = np.linspace(-np.pi, np.pi, 50)
X, Y = np.meshgrid(x, y)
Z = np.sin(X) * np.cos(2.*Y)
# draw a filled contour plot and add a colorbar with drawedges turned on
contours = plt.contourf(x, y, Z)
cb = plt.colorbar(orientation='horizontal', drawedges=True)
# turn off tick marks so the edges can be seen
for tick in cb.ax.get_xticklines() + cb.ax.get_yticklines():
tick.set_visible(False)
# save as a PDF and a PNG
plt.savefig('test.pdf')
plt.savefig('test.png')
------------------------------------------------------------------------------
Everyone hates slow websites. So do we.
Make your web apps faster with AppDynamics
Download AppDynamics Lite for free today: http://p.sf.net/sfu/appdyn_sfd2d_oct