Hi,
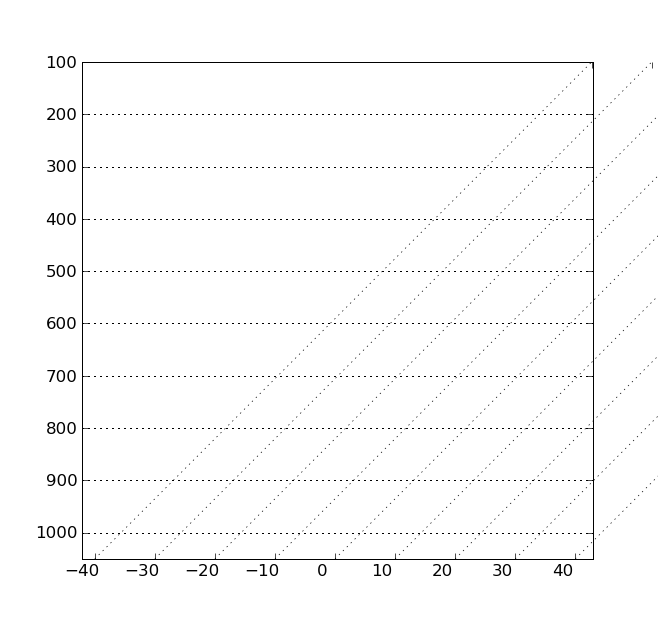
Can anyone explain how the clipping code works? Or maybe how the backends decide whether to draw a line? In working on drawing skewT's, I need slanted gridlines. Through proper setting of transforms, I can get them to draw slanted fine, but because they are slanted, the data x range at the top of the plot is not equal to the data x range at the bottom.
One issue that crops up as a result (which I've mentioned before) is that the tickmarks at the top get drawn off past the right end of the plot (enabling clipping of ticklines fixes this).
The second issue, which is the focus here, is that it seems impossible to get matplotlib to draw any gridlines that start before the left side of the chart. I can tweak Axis.draw() and get it to draw *all* the currently set tick marks and I can disable clipping so that the gridlines draw past the *right* side of the plot, but I can't seem to figure out how to draw a grid lines that starts from off the left side.
I've attached a small example of what I'm trying to do and an example of the results I'm getting with a few of the mods I've done to MPL (also attached).
Can anybody point me where I've gone wrong? I traced the calls down to the renderer (in this case GTK), but they for some reason won't trace down any further.
Ryan
axis_draw_changes.diff (923 Bytes)
skew-example.py (3.4 KB)
···
--
Ryan May
Graduate Research Assistant
School of Meteorology
University of Oklahoma