Can ticks and ticklabels be placed outside axis limits?

I have profiles that plot outside the axes limits. That is a given. It cannot be extended as it is shared with more axes below and above that have raster data with a strict extent.

I would like to provide a scale in the form of an axis spine to the first profile (see attached code and figure).

Is there a way to place ticks and ticklabels outside the axis limit?

fig, ax = plt.subplots()
y = np.linspace(0, 10, 100)
x = 10 * np.sin(y)
x_offsets = np.linspace(0, 100, 20)
for offset in x_offsets: 
    if offset == 0:
        color = 'tab:blue'
        ax.axvline(0, color=color, ls='dotted', lw=0.5)
    else:
        color = 'k'
        
    ax.plot(x + offset, y, color, clip_on=False)

ax.spines['left'].set_visible(False)
ax.spines['right'].set_visible(False)
ax.spines['bottom'].set_visible(False)

major_ticks = np.linspace(x.min(), x.max(), 5)
minor_ticks = np.linspace(x.min(), x.max(), 9)
ax.set_xticks(major_ticks)
ax.set_xticks(minor_ticks, True)
ax.spines['top'].set_bounds(major_ticks[0], major_ticks[-1])
ax.spines['top'].set_color('tab:blue')
ax.xaxis.tick_top()
ax.tick_params('x', which='both', color='tab:blue', labelcolor='tab:blue')
ax.set_xlabel('x label', position=(0, -0.1), color='tab:blue')
ax.xaxis.set_label_position('top')

# ax.tick_params('x', which='both', bottom=False, top=False, labelbottom=False)
ax.tick_params('y', which='both', left=False, right=False, labelleft=False)

ax.axis((0, 100, 0, 11))

It’s not very clear what you are after. CAn you sketch it?

Usually when making waterfall plots I just make a big axes and then offset each curve by a set amount in x.

Note that the top spine is labeled and shows ticks from 0 to 10. It should have ticks and labels from -10 to 10 but those don’t show as they are outside the xaxis limit.

I would just set the xlims from -10 to +10 and then offset the axes position by half its width to the left. It it’s still not particularly clear what you are trying to keep the axes aligned with in the other “shared” axes. Are they really “shared” or do you just need them in the right place?

I am not allowed to edit the original post anymore but here is a more complex example that I hope will clarify what I need.

I would like ticks and ticklabels to remain visible on the top spine, even if they are outside the xaxis limits.

import numpy as np
import matplotlib.pyplot as plt

# make some sample data
dx = dy = 1
y = np.arange(80, 0 - dy, -dy)
x = np.arange(0, 100 + dx, dx)
x_offsets = np.linspace(0, 100, 11)

xx, yy = np.meshgrid(0.05 * (x + 10), 0.1 * (y - 40))
data1 = np.exp(-xx**2 - yy**2) - np.exp(-(xx - 1)**2 - (yy - 1)**2)

xx, yy = np.meshgrid(0.05 * (x - 90), 0.1 * (y - 40))
data2 = np.exp(-xx**2 - yy**2) - np.exp(-(xx - 1)**2 - (yy - 1)**2)

data = data1 + data2
data += np.random.rand(data.shape[0], data.shape[1]) * 0.5 * data

extent = (x[0] - 0.5, x[-1] + 0.5, y[-1] - 0.5, y[0] + 0.5)

# set up the plot
fig, ax = plt.subplots(
    2, 2, sharey=True, figsize=(8, 4),
    gridspec_kw=dict(width_ratios=(0.2, 1), wspace=0.1)
)
axTL = ax[0, 0]
axTR = ax[0, 1]
axBL = ax[1, 0]
axBR = ax[1, 1]

data_abs_max = np.abs(data).max()
im = axBR.imshow(data, 'RdBu_r', vmin=-data_abs_max, vmax=data_abs_max,
                 extent=extent, aspect='auto', interpolation='bilinear')
axBR.axis(extent)

axBL.plot(data.sum(axis=1), y, 'k')

scale = 8
for offset in x_offsets: 
    profile = data[:, int(offset / dx)]
    profile = scale * profile + offset
    
    if offset == 0:
        color = 'tab:blue'
        axTR.axvline(0, color=color, ls='dotted', lw=0.5)
        xmin, xmax = profile.min(), profile.max()
    else:
        color = 'k'
    axTR.plot(profile, y, color, clip_on=False)
    
# remove unwanted spines and ticks
axTR.spines['left'].set_visible(False)
axTR.spines['right'].set_visible(False)
axTR.spines['bottom'].set_visible(False)
axTR.tick_params('both', which='both', left=False, right=False, bottom=False,
                 labelleft=False, labelbottom=False)

axTL.spines['top'].set_visible(False)
axTL.spines['right'].set_visible(False)
axTL.spines['bottom'].set_visible(False)
axTL.tick_params('both', which='both', top=False, right=False, bottom=False,
                 labelbottom=False)

axBR.tick_params('both', which='both', labelleft=False)


# add a top spine for scale
major_ticks = np.linspace(xmin, xmax, 5)
minor_ticks = np.linspace(xmin, xmax, 4)
axTR.set_xticks(major_ticks)
axTR.set_xticks(minor_ticks, True)
axTR.spines['top'].set_bounds(major_ticks[0], major_ticks[-1])
axTR.spines['top'].set_color('tab:blue')
axTR.tick_params('x', which='both', labeltop=True, color='tab:blue',
                 labelcolor='tab:blue', rotation=90)
axTR.set_xlabel('x label', position=(0, -0.1), color='tab:blue')
axTR.xaxis.set_label_position('top')

axTR.axis(extent)

I don’t know of any way to put the spine somewhere not on the axes.

Have you tried this with inset axes https://matplotlib.org/3.1.1/api/_as_gen/matplotlib.axes.Axes.inset_axes.html#matplotlib.axes.Axes.inset_axes ? make the upper parent axes have data limits as your lower axes, and then place the inset axes in a blended transform with the x direction in data units, and the y-direction in axes units.

Something like this:

import matplotlib.pyplot as plt
import matplotlib.transforms as mtransforms
import numpy as np
fig, axs = plt.subplots(2, 1, sharex=True)

axs[1].set_xlim(0, 100)

trans = mtransforms.blended_transform_factory(axs[0].transData, axs[0].transAxes)
aa = []
dx = 10
for i in range(0, 11):
    aa += [axs[0].inset_axes([10 * (i - 0.5), 0, dx, 1], transform=trans)]
    x = np.arange(0, 8, 0.1)
    aa[i].plot(np.sin(x + i/3), x)
    aa[i].set_facecolor('none')
    if i > 0:
        for sp in ['right', 'left', 'top', 'bottom']:
            aa[i].spines[sp].set_visible(False)
        aa[i].set_xticks([])
        aa[i].set_yticks([])
    else:
        aa[i].spines['left'].set_position('center')
        aa[i].spines['right'].set_visible(False)
        aa[i].spines['bottom'].set_visible(False)
        aa[i].xaxis.set_label_position('top')
        aa[i].xaxis.tick_top() 

for sp in ['right', 'left', 'top', 'bottom']:
    axs[0].spines[sp].set_visible(False)
axs[0].set_xticks([])
axs[0].set_yticks([])
plt.show()

Gets you…

1 Like

Edit: Ah, didn’t see you posted something already. This may or may not be relevant now.

I think the main problem is that the 0 of the x-axis on the top Axes needs to align with the 0 of the bottom-right Axes. Trying to put ticks outside is actually a workaround, sort of. This is something a constraint solver could help with, but I’m not sure if constrained layout implements this.

Thanks a lot @jklymak!

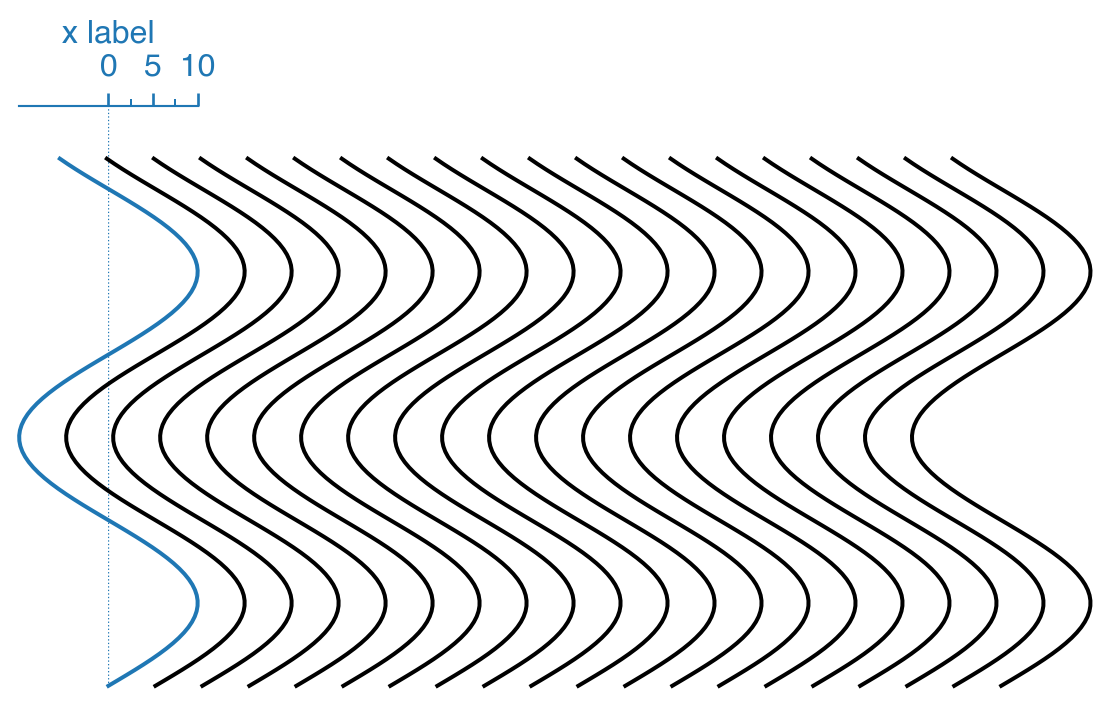
Adding an individual axes with blended transform is something I would have never thought of myself.

Adding an axes for every profile does make plotting a bit slow though. I went with adding an axes for only the first profile and plotting the others in the parent axes. ~1 s vs. ~70 ms on a MacBook Pro, 15-inch, 2016, 2.7 GHz Intel Core i7.

Also, I am not sure what is the advantage of using an inset axes. I guess the same would work with fig.add_axes.

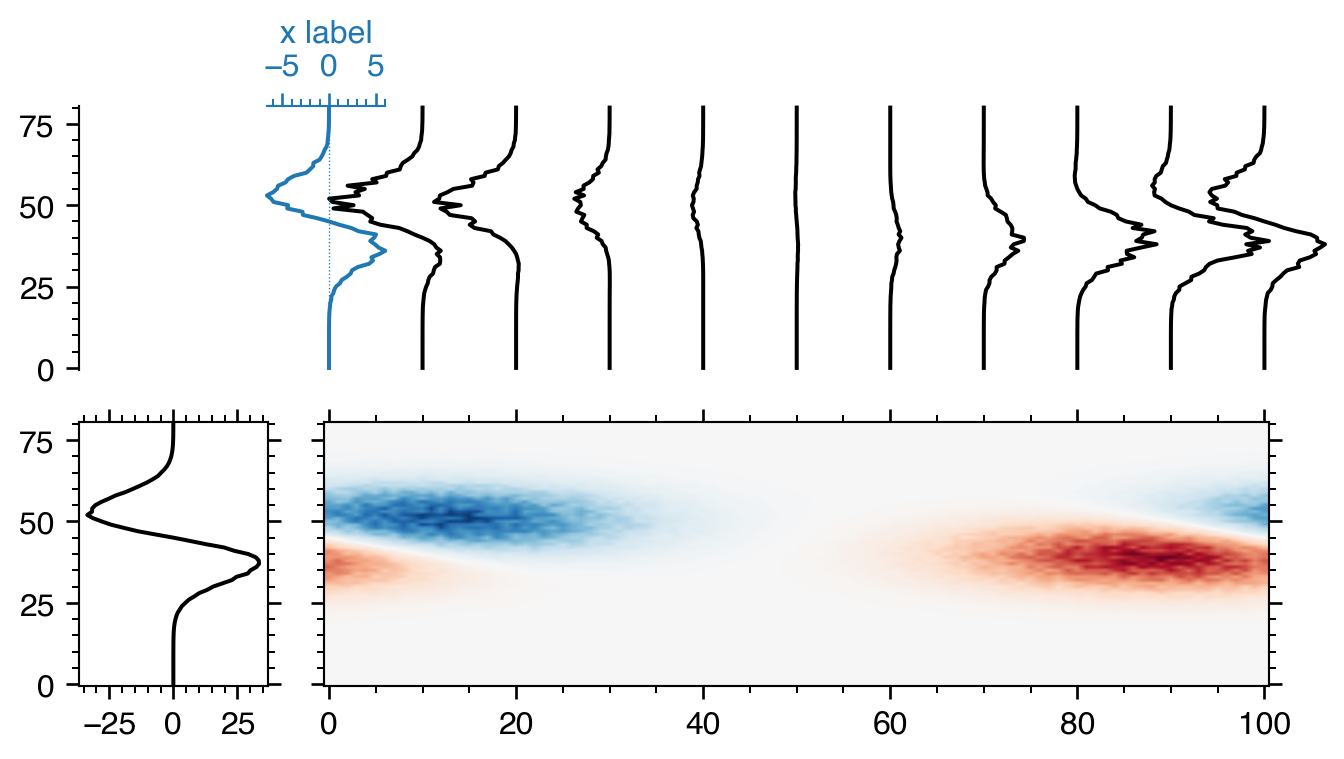
I am posting the full code for the more complex example in case someone (probably future-me) runs into this problem again:

import numpy as np
import matplotlib.pyplot as plt
from matplotlib.transforms import blended_transform_factory

# make some sample data
dx = dy = 1
y = np.arange(80, 0 - dy, -dy)
x = np.arange(0, 100 + dx, dx)
x_offsets = np.linspace(0, 100, 11)

xx, yy = np.meshgrid(0.05 * (x + 10), 0.1 * (y - 40))
data1 = np.exp(-xx**2 - yy**2) - np.exp(-(xx - 1)**2 - (yy - 1)**2)

xx, yy = np.meshgrid(0.05 * (x - 90), 0.1 * (y - 40))
data2 = np.exp(-xx**2 - yy**2) - np.exp(-(xx - 1)**2 - (yy - 1)**2)

data = data1 + data2
data += np.random.rand(data.shape[0], data.shape[1]) * 0.5 * data

extent = (x[0] - 0.5 * dx, x[-1] + 0.5 * dx, y[-1] - 0.5 * dy, y[0] + 0.5 * dy)

# set up the plot
fig, ax = plt.subplots(
    2, 2, sharey=True, figsize=(8, 4),
    gridspec_kw=dict(width_ratios=(0.2, 1), wspace=0.1)
)
axTL = ax[0, 0]
axTR = ax[0, 1]
axBL = ax[1, 0]
axBR = ax[1, 1]

trans = blended_transform_factory(axTR.transData, axTR.transAxes)

data_abs_max = np.abs(data).max()
im = axBR.imshow(data, 'RdBu_r', vmin=-data_abs_max, vmax=data_abs_max,
                 extent=extent, aspect='auto', interpolation='bilinear')
axBR.axis(extent)

axBL.plot(data.sum(axis=1), y, 'k')

scale = 8
for offset in x_offsets:
    profile = data[:, int(offset / dx)]
    profile = scale * profile
    xmin, xmax = profile.min(), profile.max()
    
    if offset == 0:
        bounds = (offset + xmin, 0, xmax - xmin, 1)
        inset_ax = axTR.inset_axes(bounds, transform=trans)
        inset_ax.set_ylim(axTR.get_ylim())
        inset_ax.set_xlim(xmin, xmax)
        
        color = 'tab:blue'
        inset_ax.axvline(0, color=color, ls='dotted', lw=0.5)
        inset_ax.plot(profile, y, color, clip_on=False, zorder=1)
        inset_ax.set_facecolor('none')
        
        inset_ax.spines['left'].set_visible(False)
        inset_ax.spines['bottom'].set_visible(False)
        inset_ax.spines['right'].set_visible(False)
        
        inset_ax.spines['top'].set_color('tab:blue')
        inset_ax.tick_params(
            'both', which='both',
            top=True, left=False, right=False, bottom=False,
            labeltop=True, labelleft=False,
            color='tab:blue', labelcolor='tab:blue'
        )
        inset_ax.set_xlabel('x label', color='tab:blue')
        inset_ax.xaxis.set_label_position('top')
        inset_ax.xaxis.tick_top() 
    else:
        color = 'k'
        
        axTR.plot(profile + offset, y, color, clip_on=False, zorder=0)

# remove unwanted spines and ticks
axTR.axis('off')

axTL.spines['top'].set_visible(False)
axTL.spines['right'].set_visible(False)
axTL.spines['bottom'].set_visible(False)
axTL.tick_params('both', which='both', top=False, right=False, bottom=False,
                 labelbottom=False)

axBR.tick_params('both', which='both', labelleft=False)

axTR.axis(extent)

Fair enough about it being slow. I may be being dumb in how I’m hiding the axes elements etc as well.

I think using inset_axes is just an easy way to align the axes relative to the parent. You could do the math in the blended transform yourself w/o too much issue. But if you did this right, zooming on the bottom axis will zoom the profiles as well. Though a bit messily as you have clipping turned off.

Actually, in the end, the blended transform is not really needed. This is just as easily accomplished by inset_ax = ax.inset_axes(bounds, transform=ax.transData) and then bounds are in the data coordinates. But your idea to add a separate axes and elegantly align it with the parent axes was neat!

1 Like