Hi,
Is boxplot supposed to be able to handle nan?
I assumed it would, but got some unexpected results when trying so.
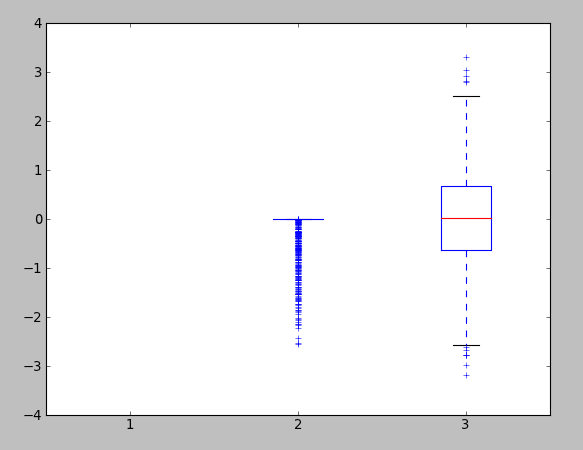
In the example below i try to create boxplot for three lists a,b,c holding samples from normal distribution. Both a and b hold nan, c not. As you can see in the attached screenshot only the boxplot for c looks ok.
In [145]: matplotlib.version
Out[145]: ‘1.1.0’
In [146]: np.version
Out[146]: ‘1.6.1’
In [147]: a = [np.random.randn() if i % 5 == 0 else np.NaN for i in range(1000)]
In [148]: b = [np.random.randn() if i < 500 else np.NaN for i in range(1000)]
In [149]: c = np.random.randn(1000)
In [150]: d = boxplot([a, b, c])
In [151]: d[‘medians’][0].get_data()
Out[151]: (array([ 0.85, 1.15]), array([ nan, nan]))
In [152]: d[‘medians’][1].get_data()
Out[152]: (array([ 1.85, 2.15]), array([ nan, nan]))
In [153]: d[‘medians’][2].get_data()
Out[153]: (array([ 2.85, 3.15]), array([ 0.01285423, 0.01285423]))
Wouter