I noticed today that when I create a bar graph with zero values that the labels don’t align correctly:
import matplotlib.pyplot as plt
import numpy as np
fig = plt.figure()
names = [‘name a’, ‘name b’, ‘name c’, ‘named’, ‘name e’, ‘name f’]
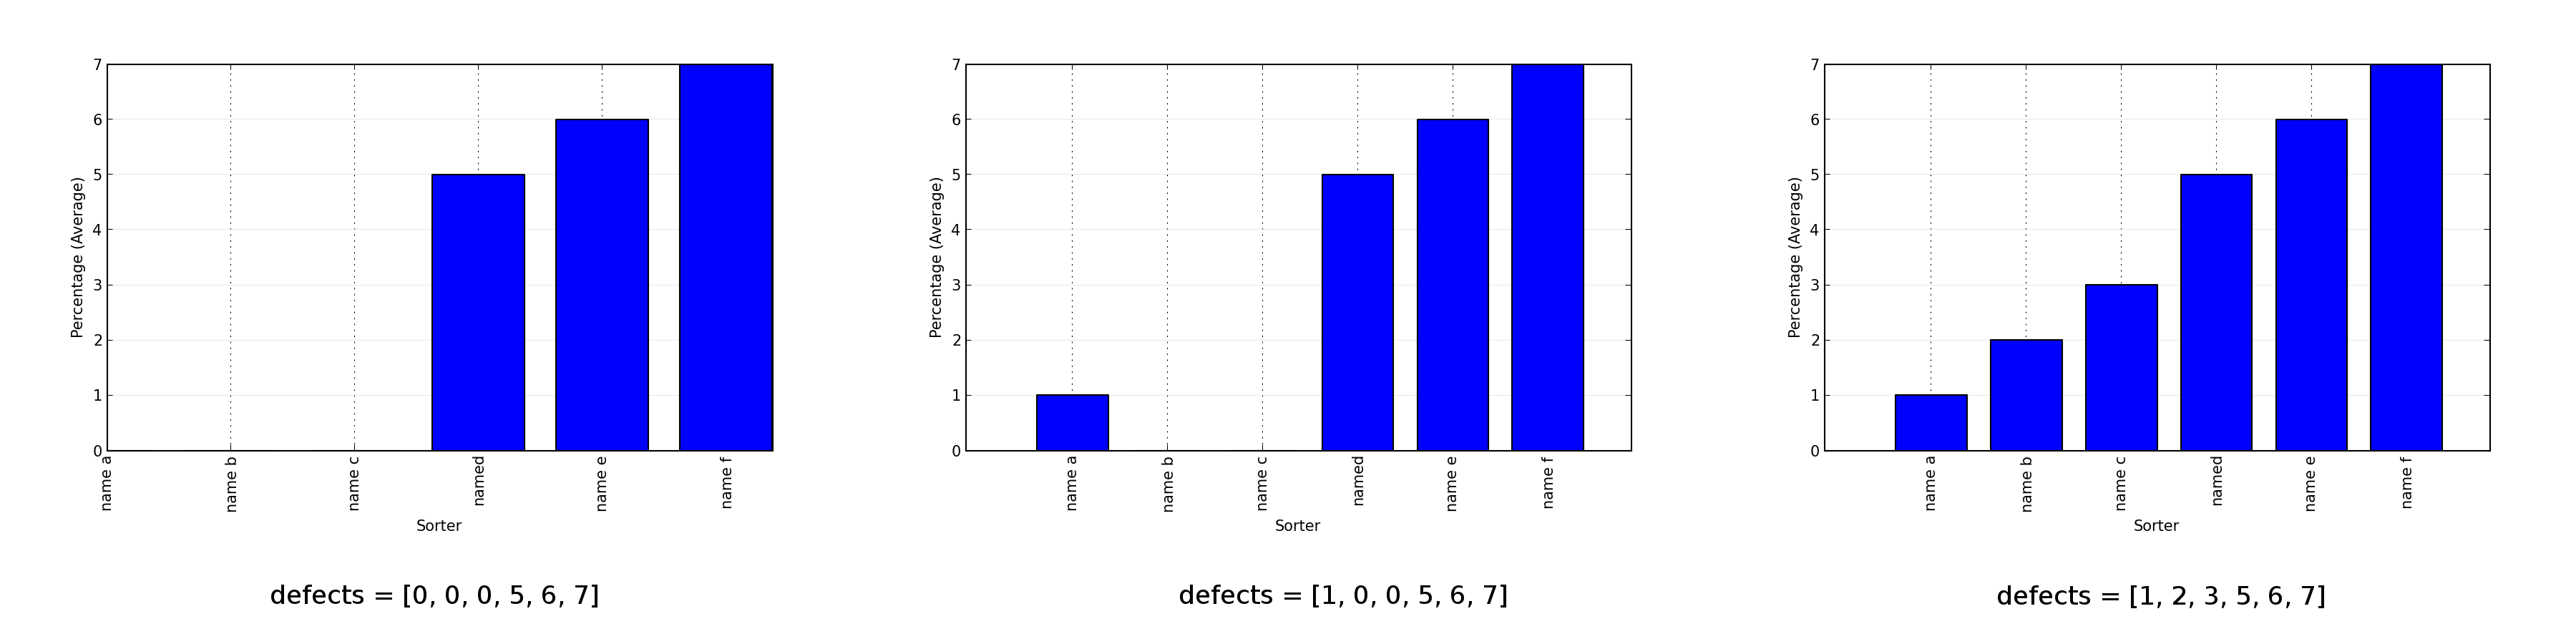
defects = [0, 0, 0, 5, 6, 7]
ax = fig.add_subplot(111)
widths=.75
ind = np.arange(len(defects)) # the x locations for the groups
ind = ind + widths
bar = ax.bar(ind, defects, width=widths)
plt.xticks(ind + widths/2.0 , names, rotation=90)
ax.set_xlabel(‘Sorter’)
ax.set_ylabel(‘Percentage (Average)’)
plt.subplots_adjust( bottom=0.30)
ax.yaxis.grid(True, linestyle=’-’, which=‘major’, color=‘lightgrey’, alpha=0.5)
ax.set_axisbelow(True)
plt.savefig(‘temp.png’)
defects = [1, 2, 3, 5, 6, 7]
same code…
When run with the defects with non zero values, the labels appear as I expect; with zero values, the left label aligns incorrectly with the y axis.
Thanks
P.
Hi Paul,
I noticed today that when I create a bar graph with zero values that
the labels don't align correctly:
When I run your code with defects = [0, 0, 0, 5, 6, 7], I don't notice a
misalignment of xlabels, but rather a issue with xaxis scaling being
different (and not very good). So it would be more an issue of xaxis
autoscaling.
Maybe you can send a link to your saved figure to check we are talking
of the same thing. I've attached my figures (manual 3 panels composition).
Also, I've noticed that the xscaling issue doesn't come from zero values
in general, but from defects[0] being zero.
Best,
Pierre
···
Le 26/09/2012 18:14, Paul Tremblay a écrit :
This issue has been mentioned before. The problem happens for a zero bar on either end. Particularly, a bar with zero height does not register a bbox for determining the axis limits. We will likely need a slightly different way of autoscaling for bar()
Ben Root
···
On Thursday, September 27, 2012, Pierre Haessig wrote:
Hi Paul,
Le 26/09/2012 18:14, Paul Tremblay a écrit :
I noticed today that when I create a bar graph with zero values that
the labels don’t align correctly:
When I run your code with defects = [0, 0, 0, 5, 6, 7], I don’t notice a
misalignment of xlabels, but rather a issue with xaxis scaling being
different (and not very good). So it would be more an issue of xaxis
autoscaling.
Maybe you can send a link to your saved figure to check we are talking
of the same thing. I’ve attached my figures (manual 3 panels composition).
Also, I’ve noticed that the xscaling issue doesn’t come from zero values
in general, but from defects[0] being zero.
Best,
Pierre
As an epic hack/workaround. Could you set bars of zero height to
instead be of height, 10e-5. Or something small compared to whatever
the current scale on the y-axis is. Or call ax.set_xlim yourself after
plotting? It's not ideal, but does it help?
Like Ben said, the bbox should account for all possible bar locations,
regardless of height, for this to behave as expected.
···
On Thu, Sep 27, 2012 at 1:07 PM, Benjamin Root <ben.root@...1304...> wrote:
On Thursday, September 27, 2012, Pierre Haessig wrote:
Hi Paul,
Le 26/09/2012 18:14, Paul Tremblay a écrit :
> I noticed today that when I create a bar graph with zero values that
> the labels don't align correctly:
When I run your code with defects = [0, 0, 0, 5, 6, 7], I don't notice a
misalignment of xlabels, but rather a issue with xaxis scaling being
different (and not very good). So it would be more an issue of xaxis
autoscaling.
Maybe you can send a link to your saved figure to check we are talking
of the same thing. I've attached my figures (manual 3 panels composition).
Also, I've noticed that the xscaling issue doesn't come from zero values
in general, but from defects[0] being zero.
Best,
Pierre
This issue has been mentioned before. The problem happens for a zero bar on
either end. Particularly, a bar with zero height does not register a bbox
for determining the axis limits. We will likely need a slightly different
way of autoscaling for bar()
Ben Root
--
Damon McDougall
http://www.damon-is-a-geek.com
B2.39
Mathematics Institute
University of Warwick
Coventry
West Midlands
CV4 7AL
United Kingdom