Hi!
I am wondering if there is a bug in:
mpl_toolkits.axes_grid1.AxesGrid
I am trying to run this example (I am of course working on something else, but I am trying to build a minimal example of my problem):
http://matplotlib.sourceforge.net/examples/axes_grid/demo_axes_grid.html
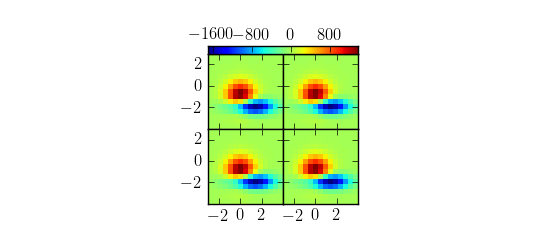
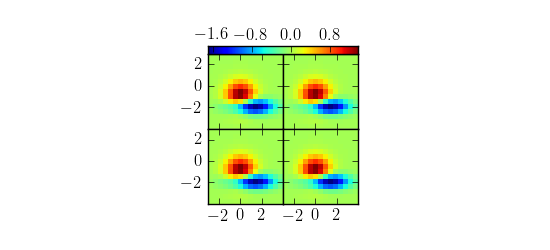
This would be a very compact and nice way of showing my results, and I am beginning to love it. There is one thing, though. Given the code attached at the end of this message, the two versions produce figures that look identical. To my mind, however, it doesn't exactly seem that the colorbars are "shared" in any real sense.
Try commenting out the 2-3 lines marked # Version 1 and # Version 2. I attach two plots of what I get: same-looking plots with wildly varying colorbar numbers. I'd like to get the numbers to be the same.
TL;DR: In version 1 I am scaling the data for one of the contour plots by a factor 1000, and would expect that plot to look quite different from the others.
Cheers
Paul.
# CODE:
import matplotlib
matplotlib.use('agg')
import matplotlib.pyplot as plt
from mpl_toolkits.axes_grid1 import AxesGrid
def get_demo_image():
import numpy as np
from matplotlib.cbook import get_sample_data
f = get_sample_data("axes_grid/bivariate_normal.npy", asfileobj=False)
z = np.load(f)
# z is a numpy array of 15x15
return z, (-3,4,-4,3)
def demo_grid_with_single_cbar(fig):
"""
A grid of 2x2 images with a single colobar
"""
grid = AxesGrid(fig, 132, # similar to subplot(132)
nrows_ncols = (2, 2),
axes_pad = 0.0,
share_all=True,
label_mode = "L",
cbar_location = "top",
cbar_mode="single")
Z, extent = get_demo_image()
# Version 1
#for i in range(3):
#im = grid[i].imshow(Z, extent=extent, interpolation="nearest")
#im = grid[3].imshow(1000 * Z, extent=extent, interpolation="nearest")
# Version 2
for i in range(4):
im = grid[i].imshow(Z, extent=extent, interpolation="nearest")
# The rest is the same
grid.cbar_axes[0].colorbar(im)
# This affects all axes as share_all = True.
grid.axes_llc.set_xticks([-2, 0, 2])
grid.axes_llc.set_yticks([-2, 0, 2])
if 1:
F = plt.figure(1, (5.5, 2.5))
F.subplots_adjust(left=0.05, right=0.98)
demo_grid_with_single_cbar(F)
plt.savefig('cbars')
#plt.draw()
#plt.show()