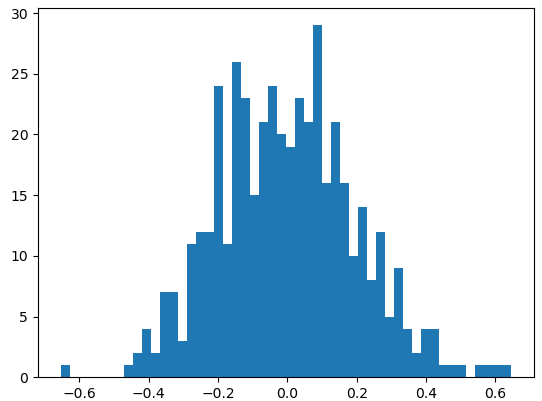
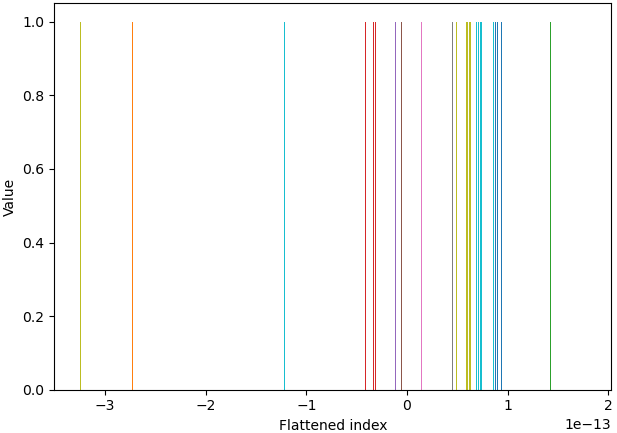
I am trying to use ax.hist(vector1d, 20, density=0) to plot the histogram, where the vector1d is a tensor of decimals in the level of 1e-13, i.e.,
>>> one_batch_error_grad
tensor([-1.3246e-13, -1.0851e-13, -1.0851e-13,  ...,  5.2838e-14,
         4.4859e-14, -3.1314e-14])
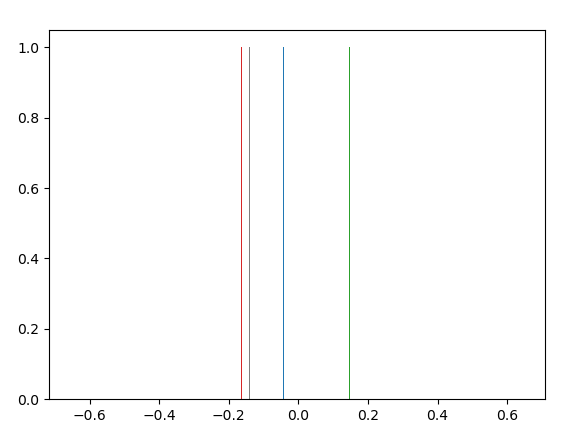
But I got the histogram as below, since like the ax.hist() cannot deal with small decimal numbers? I have used it for
Is it because of the version? I am using matplotlib==3.3.2