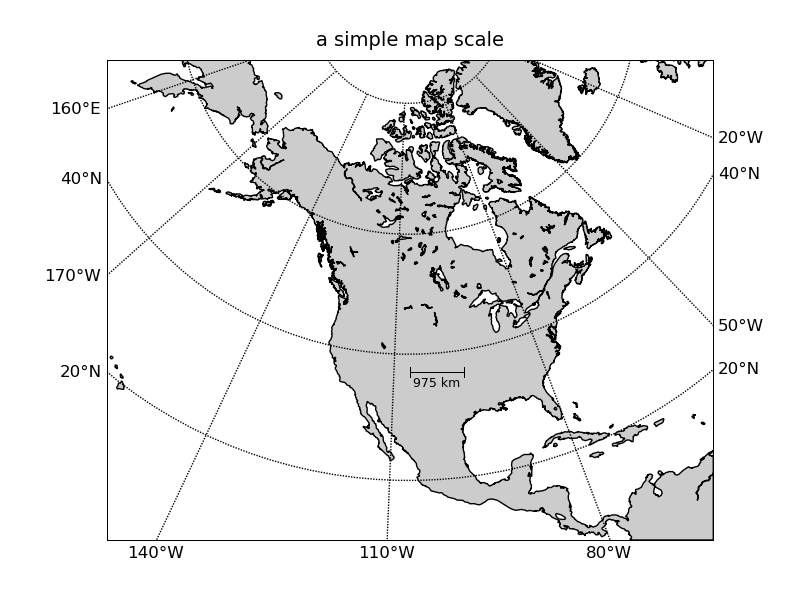
Jeff - That would replicate the “simple” scale-bar from GMT. Below is my not-complete attempt at replicating the “fancy” scale bar. It would need some options for specifying different units (miles, nautical miles, etc.) and perhaps some more attention to spacing of the text from the scale bar and tick marks…
–Mike
from numpy import *
from matplotlib.toolkits.basemap import Basemap, pyproj
from pylab import *
add drawscale method to Basemap class.
class Basemap2(Basemap):
def drawscale(self,lon,lat,length,yoffset=None):
“”"draw a fancy map scale from lon-length/2,lat-yoffset to
lon-length/2,lat-yoffset, label it with actual distance in km"""
length = length*1000 #input length is km
#we need 5 sets of x coordinates (in map units)
#center of scale
xc,yc = self(lon,lat)
#left edge of scale
lon1,lat1 = self(xc-length/2,yc,inverse=True)
x1,y1 = self(lon1,lat1)
#quarter scale
lon2,lat2 = self(xc-length/4,yc,inverse=True)
x2,y2 = self(lon2,lat2)
#three quarter scale
lon3,lat3 = self(xc+length/4,yc,inverse=True)
x3,y3 = self(lon3,lat3)
#right edge of scale
lon4,lat4 = self(xc+length/2,yc,inverse=True)
x4,y4 = self(lon4,lat4)
if yoffset is None: yoffset = 0.1*length
#plot top line
ytop = yc+yoffset/2
ybottom = yc-yoffset/2
ytick = ybottom - yoffset/2
ytext = ytick - yoffset/2
m.plot([x1,x4],[ytop,ytop],color=‘k’)
#plot bottom line
m.plot([x1,x4],[ybottom,ybottom],color=‘k’)
#plot left edge
m.plot([x1,x1],[ybottom,ytop],color=‘k’)
#plot right edge
m.plot([x4,x4],[ybottom,ytop],color=‘k’)
#make a filled black box from left edge to 1/4 way across
fill([x1,x2,x2,x1,x1],[ytop,ytop,ybottom,ybottom,ytop],‘k’)
#make a filled white box from 1/4 way across to 1/2 way across
fill([x2,xc,xc,x2,x2],[ytop,ytop,ybottom,ybottom,ytop],‘w’)
#make a filled white box from 1/2 way across to 3/4 way across
fill([xc,x3,x3,xc,xc],[ytop,ytop,ybottom,ybottom,ytop],‘k’)
#make a filled white box from 3/4 way across to end
fill([x3,x4,x4,x3,x3],[ytop,ytop,ybottom,ybottom,ytop],‘w’)
#plot 3 tick marks at left edge, center, and right edge
m.plot([x1,x1],[ytick,ybottom],color=‘k’)
m.plot([xc,xc],[ytick,ybottom],color=‘k’)
m.plot([x4,x4],[ytick,ybottom],color=‘k’)
#label 3 tick marks
text(x1,ytext,’%d’ % (0),\
	    horizontalalignment='center',\

	    verticalalignment='top',\

	    fontsize=9)
text(xc,ytext,’%d’ % (round((length/2)/1000)),\
	    horizontalalignment='center',\

	    verticalalignment='top',\

	    fontsize=9)
text(x4,ytext,’%d’ % (round((length)/1000)),\
	    horizontalalignment='center',\

	    verticalalignment='top',\

	    fontsize=9)
#put units on top
text(xc,ytop+yoffset/2,‘km’,\
	    horizontalalignment='center',\

	    verticalalignment='bottom',\

	    fontsize=9)
setup of basemap (‘lcc’ = lambert conformal conic).
use major and minor sphere radii from WGS84 ellipsoid.
m = Basemap2(llcrnrlon=-145.5,llcrnrlat=1.,urcrnrlon=-2.566,urcrnrlat=46.352,\
	      rsphere=(6378137.00,6356752.3142),\

	      resolution='l',area_thresh=1000.,projection='lcc',\

	      lat_1=50.,lon_0=-107.)
draw coastlines and political boundaries.
m.drawcoastlines()
m.fillcontinents()
draw parallels and meridians.
label on left, right and bottom of map.
m.drawparallels(arange(0.,80,20.),labels=[1,1,0,1])
m.drawmeridians(arange(10.,360.,30.),labels=[1,1,0,1])
draw a line from x1,y to x2,y and label it with distance in km.
length = 3000 #kilometers
x1,y1 = 0.25m.xmax, 0.25m.ymax
lon1,lat1 = m(x1,y1,inverse=True)
m.drawscale(lon1,lat1,length)
title(‘a fancy map scale’)
show()
···
Michael Hearne
mhearne@…924…
(303) 273-8620
USGS National Earthquake Information Center
1711 Illinois St. Golden CO 80401
Senior Software Engineer
Synergetics, Inc.