Travis Brady wrote:
I'd like to make a map of the U.S. where I draw the state lines and
apply a color to each state based on a ratio I've got in my data. I'm
staring at the example here:
http://matplotlib.sourceforge.net/screenshots/plotmap.py, but what I'm
trying to do is much simpler so I'm wondering if there's a helper
function somewhere.thanks,
Travis
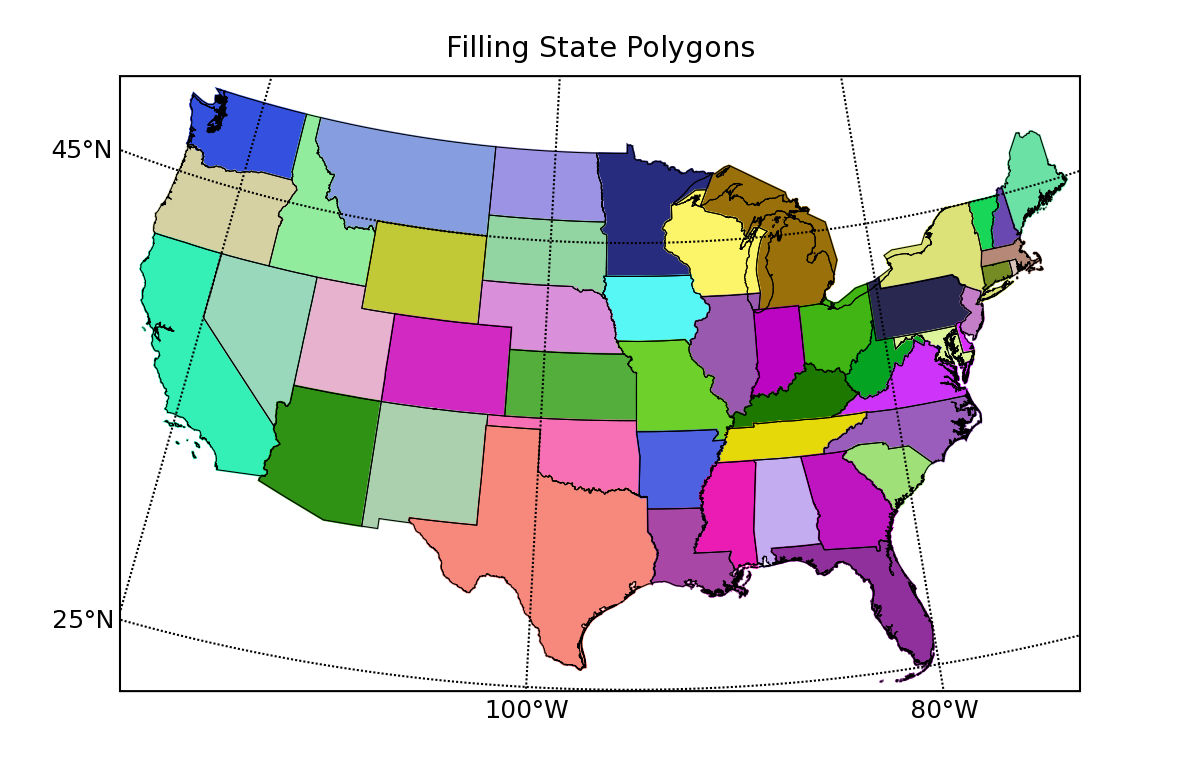
Travis: The state boundaries that come with basemap are not polygons,
but line segments, so you can't fill them. However, you can download a
shapefile from
http://nationalatlas.gov/atlasftp.html?openChapters=chpbound#chpbound
(statesp020.tar.gz is the one you want). Then you can use the new
'readshapefile' method in Basemap 0.6 to do what you want. I've
attached an example that shows how to do it.
HTH,
-Jeff
fillstates.py (1.19 KB)
···
--
Jeffrey S. Whitaker Phone : (303)497-6313
Meteorologist FAX : (303)497-6449
NOAA/OAR/CDC R/CDC1 Email : Jeffrey.S.Whitaker@...259...
325 Broadway Office : Skaggs Research Cntr 1D-124
Boulder, CO, USA 80303-3328 Web : Jeffrey S. Whitaker: NOAA Physical Sciences Laboratory