Hi all,
Is it possible to import colormap file from GMT (.cpt) to basemap? If yes how
can we do that?
Thanks
···
--
Lionel Roubeyrie - lroubeyrie@...1068...
LIMAIR
http://www.limair.asso.fr
Hi all,
Is it possible to import colormap file from GMT (.cpt) to basemap? If yes how
can we do that?
Thanks
--
Lionel Roubeyrie - lroubeyrie@...1068...
LIMAIR
http://www.limair.asso.fr
It's possible. Here's how I've been doing it.
(1) I use the gmtcolormapPylab function defined in:
http://sourceforge.net/mailarchive/message.php?msg_id=11255878
(2) Using the above function and a GMT cpt file (e.g.
GMT_no_green.cpt), I set a color dictionary as:
cdict = gmtcolormapPylab("GMT_no_green")
(3) I define a colormap using:
mycmap = cm.colors.LinearSegmentedColormap("GMT_no_green",cdict,256)
(4) I apply the above using cmap=mycolormap in contourf or pcolormesh.
By the way, in case you don't know of the following site, it has an
exhaustive selection of color palettes: http://cpt-city.org.uk/
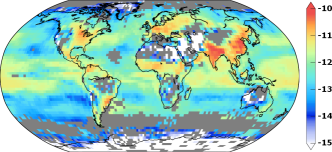
I've also attached an example of a basemap image using a cpt from the
above site. Masked values not defined by the colormap are shown in
gray.
On Friday 07 July 2006 4:11 pm, Lionel Roubeyrie wrote:
Hi all,
Is it possible to import colormap file from GMT (.cpt) to basemap?
If yes how can we do that?
Thanks
Work very fine here, thanks for the links.
Le Vendredi 07 Juillet 2006 10:11, ddlucas@...1089... a écrit :
On Friday 07 July 2006 4:11 pm, Lionel Roubeyrie wrote:
> Hi all,
> Is it possible to import colormap file from GMT (.cpt) to basemap?
> If yes how can we do that?
> ThanksIt's possible. Here's how I've been doing it.
(1) I use the gmtcolormapPylab function defined in:
http://sourceforge.net/mailarchive/message.php?msg_id=11255878(2) Using the above function and a GMT cpt file (e.g.
GMT_no_green.cpt), I set a color dictionary as:
cdict = gmtcolormapPylab("GMT_no_green")(3) I define a colormap using:
mycmap = cm.colors.LinearSegmentedColormap("GMT_no_green",cdict,256)(4) I apply the above using cmap=mycolormap in contourf or pcolormesh.
By the way, in case you don't know of the following site, it has an
exhaustive selection of color palettes: http://cpt-city.org.uk/I've also attached an example of a basemap image using a cpt from the
above site. Masked values not defined by the colormap are shown in
gray.
--
Lionel Roubeyrie - lroubeyrie@...1068...
LIMAIR
http://www.limair.asso.fr
Lionel Roubeyrie wrote:
Hi all,
Is it possible to import colormap file from GMT (.cpt) to basemap? If yes how can we do that?
Thanks
Lionel: I had included the GMT colormaps in matplotlib, but had to take them out because of licensing issues. If you want to put them back in, put the attached file in your matplotlib install directory <sys.prefix>/lib/python2.4/site-packages/matplotlib. Then use a text editor to add the following lines to _cm.py (in the same directory)
from gmt_cm import addcmaps
addcmaps(datad)
right above the line
# reverse all the colormaps.
This will give you the colormaps
GMT_gebco
GMT_globe
GMT_haxby
GMT_no_green
GMT_ocean
GMT_polar
GMT_red2green
GMT_relief
GMT_seis
GMT_wysiwyg
and the corresponding reversed colormaps (with '_r' appended to the name).
-Jeff
gmt_cm.py (25.8 KB)
--
Jeffrey S. Whitaker Phone : (303)497-6313
NOAA/OAR/CDC R/PSD1 FAX : (303)497-6449
325 Broadway Boulder, CO, USA 80305-3328
Hi Jeff,
thanks for the hint, I just need to import one personal GMT file maked a time
ago and used in a plotting project based on GMT, which I try to convert to
matplotlib.
Now I have a little problem to plot a basemap with subplots. Trying to use
contour_demo.py mixed with hist.py to have a map with contours and under it
an histogram of values, I can't set the colorbar else I loose the map. I
think I have a problem with axes but I'm not very familar with subplotting.
Have you an idea of how can I do that?
Le Vendredi 07 Juillet 2006 13:53, Jeff Whitaker a écrit :
Lionel Roubeyrie wrote:
> Hi all,
> Is it possible to import colormap file from GMT (.cpt) to basemap? If yes
> how can we do that?
> ThanksLionel: I had included the GMT colormaps in matplotlib, but had to take
them out because of licensing issues. If you want to put them back in,
put the attached file in your matplotlib install directory
<sys.prefix>/lib/python2.4/site-packages/matplotlib. Then use a text
editor to add the following lines to _cm.py (in the same directory)from gmt_cm import addcmaps
addcmaps(datad)right above the line
# reverse all the colormaps.
This will give you the colormaps
GMT_gebco
GMT_globe
GMT_haxby
GMT_no_green
GMT_ocean
GMT_polar
GMT_red2green
GMT_relief
GMT_seis
GMT_wysiwygand the corresponding reversed colormaps (with '_r' appended to the name).
-Jeff
--
Lionel Roubeyrie - lroubeyrie@...1068...
LIMAIR
http://www.limair.asso.fr
Arg, sorry, I have found the response by myself, I just have to use
figure.add_subplot to fix it.
Le Vendredi 07 Juillet 2006 15:14, Lionel Roubeyrie a écrit :
Hi Jeff,
thanks for the hint, I just need to import one personal GMT file maked a
time ago and used in a plotting project based on GMT, which I try to
convert to matplotlib.
Now I have a little problem to plot a basemap with subplots. Trying to use
contour_demo.py mixed with hist.py to have a map with contours and under it
an histogram of values, I can't set the colorbar else I loose the map. I
think I have a problem with axes but I'm not very familar with subplotting.
Have you an idea of how can I do that?Le Vendredi 07 Juillet 2006 13:53, Jeff Whitaker a écrit :
> Lionel Roubeyrie wrote:
> > Hi all,
> > Is it possible to import colormap file from GMT (.cpt) to basemap? If
> > yes how can we do that?
> > Thanks
>
> Lionel: I had included the GMT colormaps in matplotlib, but had to take
> them out because of licensing issues. If you want to put them back in,
> put the attached file in your matplotlib install directory
> <sys.prefix>/lib/python2.4/site-packages/matplotlib. Then use a text
> editor to add the following lines to _cm.py (in the same directory)
>
> from gmt_cm import addcmaps
> addcmaps(datad)
>
> right above the line
>
> # reverse all the colormaps.
>
> This will give you the colormaps
>
> GMT_gebco
> GMT_globe
> GMT_haxby
> GMT_no_green
> GMT_ocean
> GMT_polar
> GMT_red2green
> GMT_relief
> GMT_seis
> GMT_wysiwyg
>
> and the corresponding reversed colormaps (with '_r' appended to the
> name).
>
>
> -Jeff
--
Lionel Roubeyrie - lroubeyrie@...1068...
LIMAIR
http://www.limair.asso.fr
HI,
how do you set the arrows on the bottom and the top of your colorbar? I don't
find any option for that?
Thanks
Le Vendredi 07 Juillet 2006 10:11, ddlucas@...1089... a écrit :
On Friday 07 July 2006 4:11 pm, Lionel Roubeyrie wrote:
> Hi all,
> Is it possible to import colormap file from GMT (.cpt) to basemap?
> If yes how can we do that?
> ThanksIt's possible. Here's how I've been doing it.
(1) I use the gmtcolormapPylab function defined in:
http://sourceforge.net/mailarchive/message.php?msg_id=11255878(2) Using the above function and a GMT cpt file (e.g.
GMT_no_green.cpt), I set a color dictionary as:
cdict = gmtcolormapPylab("GMT_no_green")(3) I define a colormap using:
mycmap = cm.colors.LinearSegmentedColormap("GMT_no_green",cdict,256)(4) I apply the above using cmap=mycolormap in contourf or pcolormesh.
By the way, in case you don't know of the following site, it has an
exhaustive selection of color palettes: http://cpt-city.org.uk/I've also attached an example of a basemap image using a cpt from the
above site. Masked values not defined by the colormap are shown in
gray.
--
Lionel Roubeyrie - lroubeyrie@...1068...
LIMAIR
http://www.limair.asso.fr
Lionel,
Assuming you have the current version of mpl, use the "extend" kwarg:
colorbar properties:
extend='neither', 'both', 'min', 'max'
If not 'neither', make pointed end(s) for out-of-range
values. These are set for a given colormap using the
colormap set_under and set_over methods.
If the colorbar is attached to a filled contour plot, however, you do not need to specify this kwarg in the colorbar call because it will be grabbed from the ContourSet object.
Eric
Lionel Roubeyrie wrote:
HI,
how do you set the arrows on the bottom and the top of your colorbar? I don't find any option for that?
ThanksLe Vendredi 07 Juillet 2006 10:11, ddlucas@...1089... a écrit :
On Friday 07 July 2006 4:11 pm, Lionel Roubeyrie wrote:
Hi all,
Is it possible to import colormap file from GMT (.cpt) to basemap?
If yes how can we do that?
ThanksIt's possible. Here's how I've been doing it.
(1) I use the gmtcolormapPylab function defined in:
http://sourceforge.net/mailarchive/message.php?msg_id=11255878(2) Using the above function and a GMT cpt file (e.g.
GMT_no_green.cpt), I set a color dictionary as:
cdict = gmtcolormapPylab("GMT_no_green")(3) I define a colormap using:
mycmap = cm.colors.LinearSegmentedColormap("GMT_no_green",cdict,256)(4) I apply the above using cmap=mycolormap in contourf or pcolormesh.
By the way, in case you don't know of the following site, it has an
exhaustive selection of color palettes: http://cpt-city.org.uk/I've also attached an example of a basemap image using a cpt from the
above site. Masked values not defined by the colormap are shown in
gray.