Hello,
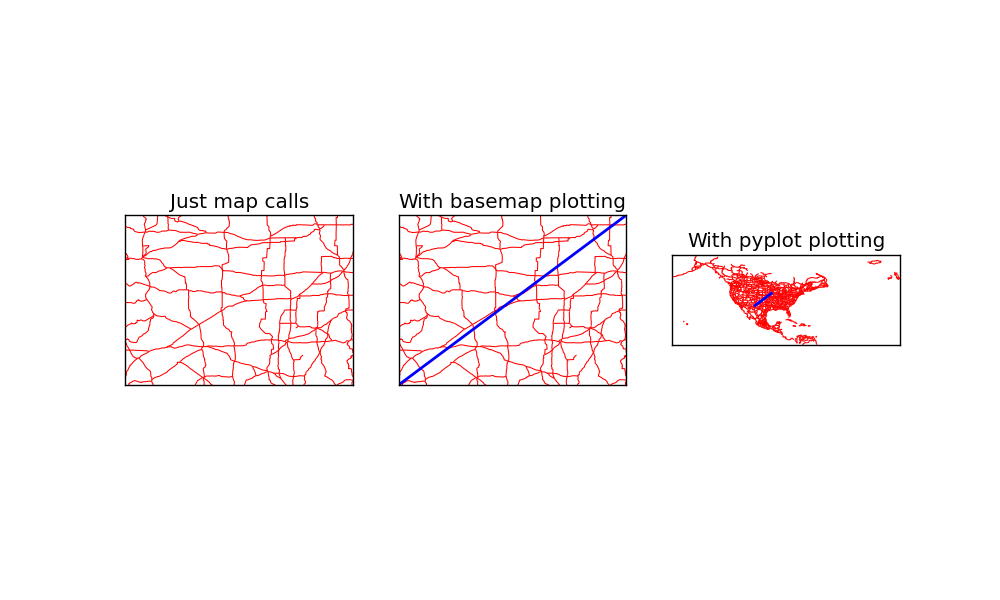
I have been tracking down an annoying (but easily worked
around) issue with Basemap. It seems that if you call .readshapefile()
to create, for example, roads on your image, and then call any pyplot
command afterwards for that axis, the axis will reset itself to the
entire domain (I guess it would be the complete domain stated in the
shapefile, maybe?). This does not happen if you call the equivalent
function from the Basemap instance, though. Also, this does not happen
with drawstates() and its ilk.
I have made a test script and a couple of supporting shapefile
in a tar.gz file to demonstrate the issue. It is available here: http://dl.dropbox.com/u/7325604/basemaptest.tar.gz
I have also attached a png
file showing the resulting image as it appears on my computer. I have
no clue as to the cause and I hope that someone here might have an idea.
Thanks,
Ben Root
I did some more digging and I think I have a hypothesis for what is happening.
There is only one main difference between a call to .drawstates() and .readshapefiles() with respect to loading and plotting data. .drawstates() loads only the line segments that coincide with the defined map boundaries, while .readshapefiles() loads all of the data in the shapefile. Therefore, the LineCollection that gets attached to the axis contains data from outside the stated domain.
In addition, the basemap versions of the plotting functions have the benefit of finishing their calls with a call to .set_axes_limits(), which keeps the axes in check. However, a non-basemap version would not call that automatically, thereby having its axes automatically expanded to contain all of the data in the LineCollection.
I am not sure what exactly should be done about this. This is certainly un-intuitive behavior, though. Maybe there could be a keyword option in .readshapefile() to have only the data for the stated domain loaded? That might solve the issue.
Thanks,
Ben Root
···
On Fri, May 21, 2010 at 4:08 PM, Benjamin Root <ben.root@…553…> wrote:
Hello,
I have been tracking down an annoying (but easily worked
around) issue with Basemap. It seems that if you call .readshapefile()
to create, for example, roads on your image, and then call any pyplot
command afterwards for that axis, the axis will reset itself to the
entire domain (I guess it would be the complete domain stated in the
shapefile, maybe?). This does not happen if you call the equivalent
function from the Basemap instance, though. Also, this does not happen
with drawstates() and its ilk.
I have made a test script and a couple of supporting shapefile
in a tar.gz file to demonstrate the issue. It is available here: http://dl.dropbox.com/u/7325604/basemaptest.tar.gz
I have also attached a png
file showing the resulting image as it appears on my computer. I have
no clue as to the cause and I hope that someone here might have an idea.
Thanks,
Ben Root
I have since switched over to the svn checkout of basemap, and this issue appears to be ‘fixed’. While readshapefile() does still load all of the data, it appears that .set_axes_limits() automatically turns off autoscaling. This should cut down on much of the “odd” behaviors users would encounter. FWIW, I was using v0.99.2 from the Fedora repos.
Ben Root
···
On Fri, May 21, 2010 at 4:57 PM, Benjamin Root <ben.root@…553…> wrote:
I did some more digging and I think I have a hypothesis for what is happening.
There is only one main difference between a call to .drawstates() and .readshapefiles() with respect to loading and plotting data. .drawstates() loads only the line segments that coincide with the defined map boundaries, while .readshapefiles() loads all of the data in the shapefile. Therefore, the LineCollection that gets attached to the axis contains data from outside the stated domain.
In addition, the basemap versions of the plotting functions have the benefit of finishing their calls with a call to .set_axes_limits(), which keeps the axes in check. However, a non-basemap version would not call that automatically, thereby having its axes automatically expanded to contain all of the data in the LineCollection.
I am not sure what exactly should be done about this. This is certainly un-intuitive behavior, though. Maybe there could be a keyword option in .readshapefile() to have only the data for the stated domain loaded? That might solve the issue.
Thanks,
Ben Root
On Fri, May 21, 2010 at 4:08 PM, Benjamin Root <ben.root@…553…> wrote:
Hello,
I have been tracking down an annoying (but easily worked
around) issue with Basemap. It seems that if you call .readshapefile()
to create, for example, roads on your image, and then call any pyplot
command afterwards for that axis, the axis will reset itself to the
entire domain (I guess it would be the complete domain stated in the
shapefile, maybe?). This does not happen if you call the equivalent
function from the Basemap instance, though. Also, this does not happen
with drawstates() and its ilk.
I have made a test script and a couple of supporting shapefile
in a tar.gz file to demonstrate the issue. It is available here: http://dl.dropbox.com/u/7325604/basemaptest.tar.gz
I have also attached a png
file showing the resulting image as it appears on my computer. I have
no clue as to the cause and I hope that someone here might have an idea.
Thanks,
Ben Root