Greetings, MPL Users.
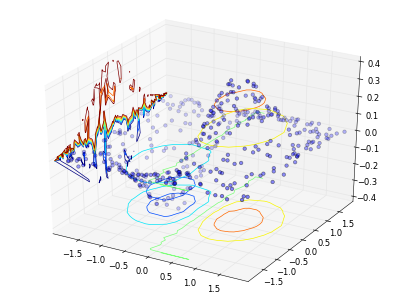
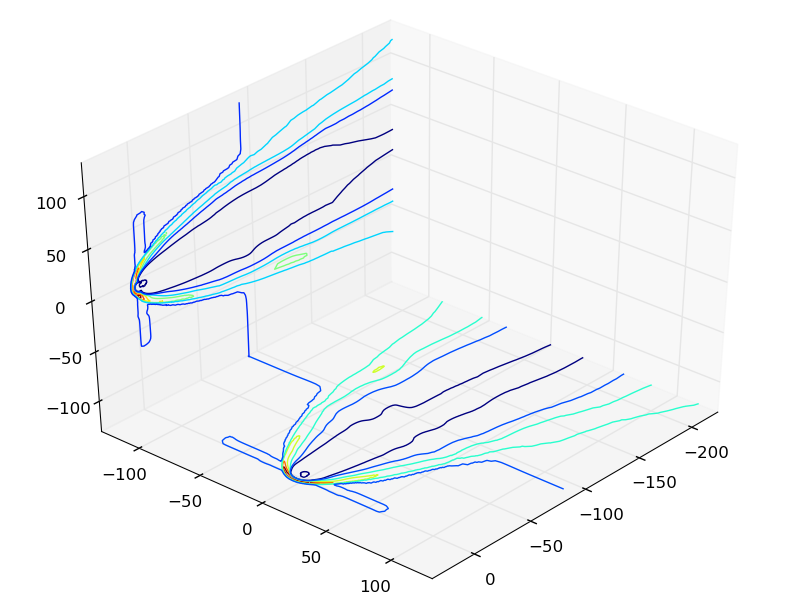
I have been experimenting with Axes3D with the hopes that I could create some 3d lines and then project some contours on different planes in the 3D axes object, much like the contour3d_demo3.py example (but with lines instead of the 3d wireframe.) The catch, however, is creating the contour objects using tricontour instead of a regular contour. Being that I typically use irregular grids for my research, the triangulate module has been a tremendous feature, but it doesn’t seem to work with Axes3D objects.
For example, this quick script:
import matplotlib.pyplot as plt
#import matplotlib.tri as tri
import numpy as np
from numpy.random import uniform, seed
from mpl_toolkits.mplot3d import Axes3D
seed(0)
npts = 200
ngridx = 100
ngridy = 200
x = uniform(-2,2,npts)
y = uniform(-2,2,npts)
z = x*np.exp(-x2-y2)
tricontour.
fig = plt.figure()
ax = Axes3D(fig)
ax.tricontour(x, y, z, 15, zdir=x, offset=-2)
plt.show()
creates a huge traceback, listed below.
Is it possible to combine tricontour with Axes3D? It would appear that they are just incompatible, but perhaps there is a way to force it to work?
Thanks for your help.
tricont3d.py in ()
20 ax.tricontour(x, y, z, 15, zdir=x, offset=-2)
21
—> 22 plt.show()
23
24
python2.6/site-packages/matplotlib/backends/backend_qt4.pyc in show()
69 figManager = Gcf.get_active()
70 if figManager != None:
—> 71 figManager.canvas.draw()
72
73 if _create_qApp.qAppCreatedHere:
python2.6/site-packages/matplotlib/backends/backend_qt4agg.pyc in draw(self)
128 if DEBUG: print “FigureCanvasQtAgg.draw”, self
129 self.replot = True
–> 130 FigureCanvasAgg.draw(self)
131 self.update()
132
site-packages/matplotlib/backends/backend_agg.pyc in draw(self)
392
393 self.renderer = self.get_renderer()
–> 394 self.figure.draw(self.renderer)
395
396 def get_renderer(self):
python2.6/site-packages/matplotlib/artist.pyc in draw_wrapper(artist, renderer, *args, **kwargs)
53 def draw_wrapper(artist, renderer, *args, **kwargs):
54 before(artist, renderer)
—> 55 draw(artist, renderer, *args, **kwargs)
56 after(artist, renderer)
57
python2.6/site-packages/matplotlib/figure.pyc in draw(self, renderer)
796 dsu.sort(key=itemgetter(0))
797 for zorder, func, args in dsu:
–> 798 func(*args)
799
800 renderer.close_group(‘figure’)
python2.6/site-packages/mpl_toolkits/mplot3d/axes3d.pyc in draw(self, renderer)
152 # Calculate projection of collections and zorder them
153 zlist = [(col.do_3d_projection(renderer), col) \
–> 154 for col in self.collections]
155 zlist.sort()
156 zlist.reverse()
AttributeError: ‘LineCollection’ object has no attribute ‘do_3d_projection’
WARNING: Failure executing file: <tricont3d.py>