Hi,
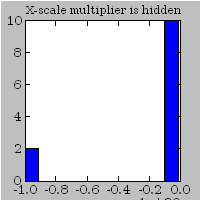
When matplotlib uses an axis multiplier, as in x-axis in the script
below, the scale factor is not positioned properly on the figure as is
shown in the attached picture. The 'x1e+30' in the bottom right corner
is clipped unless I enlarge the window.
···
--------------------
import Numeric, gtk
import matplotlib
matplotlib.use('GTK')
import matplotlib.figure, matplotlib.axes, matplotlib.backends.backend_gtk
# data
values = Numeric.array([-1e30, -1e30, 0,1,2,3,4,5,6,7,8,9], 'd')
# figure
figsize=(6,3)
figure = matplotlib.figure.Figure(figsize=figsize)
canvas = matplotlib.backends.backend_gtk.FigureCanvasGTK(figure)
axes = matplotlib.axes.Subplot(figure, 111)
figure.add_axes(axes)
axes.hist(values, bins=10)
axes.set_title('X-scale multiplier is hidden', fontsize=10)
# window to display
window = gtk.Window()
window.connect('destroy', gtk.main_quit)
window.add(canvas)
window.show_all()
gtk.main()
--------------------
I can use the axes position to work I guess but that seems rather
unsatisfactory as I'll have to figure out when it's being displayed or
not, font sizing and spacing blah blah blah.
Is there an easier way around this (or a fix?)? I'm using v0.90.0
Thanks
Tim