Hi experts.
I have two problems:
- plt.show() doesnt work: When i draw simple plot doing
import numpy as np
import matplotlib.pyplot as plt
x = np.range(0, 5, 0.1);
y = np.sin(x)
plt.plot(x, y)
plt.show()

no picture appears.I try to do this: [http://stackoverflow.com/questions/7534453/matplotlib-does-not-show-my-drawings-although-i-call-pyplot-show](http://stackoverflow.com/questions/7534453/matplotlib-does-not-show-my-drawings-although-i-call-pyplot-show), but I cant save changes in the file matplotlibrc.

But, If I do:
import numpy as np
import matplotlib.pyplot as plt
x = np.range(0, 5, 0.1);
y = np.sin(x)
plt.plot(x, y)
plt.savefig('pppp.png')
the picture is generated and saved.
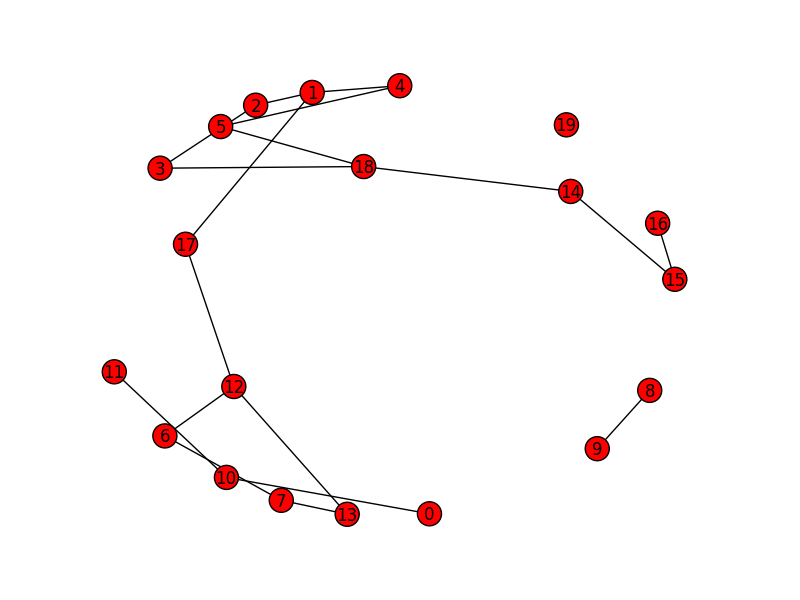
- When I try to draw a Graph (using NetworkX and Matplotlib) doing:
import numpy as np
import matplotlib.pyplot as plt
improt networkx as nx
x = nx.Graph(M) #M is my matrix
nx.draw(x)
plt.savefig('jjj.png')
I always get a pictule like the attached file. How can I restore my old-drawing style?
Waiting for your answer.
Thanks a lot!!
How did you install or build matplotlib? It sounds like you built it from source, and did not have any GUI dev tools installed. At the very minimum, matplotlib will build only the non-interactive backends as they don’t require external dependencies (which would explain why you can save images, but can’t show them). Also, what is your OS?
Cheers!
Ben Root
···
On Sun, Jul 13, 2014 at 12:17 PM, Josè Luis Mietta <joseluismietta@…720…> wrote:
Hi experts.
I have two problems:
- plt.show() doesnt work: When i draw simple plot doing
import numpy as np
import matplotlib.pyplot as plt
x = np.range(0, 5, 0.1);
y = np.sin(x)
plt.plot(x, y)
plt.show()

no picture appears.I try to do this: [http://stackoverflow.com/questions/7534453/matplotlib-does-not-show-my-drawings-although-i-call-pyplot-show](http://stackoverflow.com/questions/7534453/matplotlib-does-not-show-my-drawings-although-i-call-pyplot-show), but I cant save changes in the file matplotlibrc.


But, If I do:
import numpy as np
import matplotlib.pyplot as plt
x = np.range(0, 5, 0.1);
y = np.sin(x)
plt.plot(x, y)
plt.savefig('pppp.png')
the picture is generated and saved.
- When I try to draw a Graph (using NetworkX and Matplotlib) doing:
import numpy as np
import matplotlib.pyplot as plt
improt networkx as nx
x = nx.Graph(M) #M is my matrix
nx.draw(x)
plt.savefig('jjj.png')
I always get a pictule like the attached file. How can I restore my old-drawing style?
Waiting for your answer.
Thanks a lot!!
Matplotlib-users mailing list
Matplotlib-users@lists.sourceforge.net
https://lists.sourceforge.net/lists/listinfo/matplotlib-users