Ray,
That is absolutely beautiful work there.
At the very least, I would like to see this added to the gallery or the cookbook. The code is very nicely commented and documented. Just a few points that come to mind.
First, consider the possibility of using asanyarray() instead of asarray(). The big usecase for asanyarray is the use of masked arrays.
Second, I am personally against call signatures that are just “**kwargs” and then popping off the arguments at the beginning of the method. So long as the default value is not a mutable object, then put those arguments in the call signature with the default values. It is much more IDE and documentation-friendly this way.
Third, I would think that using plt.gca() would be better than plt.axes() just in case the user is using subplots. gca() will create an axes if none exists already.
Lastly, you should do ax.plot() instead of plt.plot() since you have already retrieved the axes object. This way, in case the axes object passed in is not the currently active axes, it would still work.
The difficulty in getting this included into matplotlib proper (and the same goes to the other thread about streamgraphs) is that these plots are done in an object oriented rather than procedural approach. Personally, I would like to see (one day) a refactor of matplotlib where everything plotable is an object that gets placed into the axes object (which, itself is a plotable that gets placed in a figure…). While the current code isn’t too far from that concept, the interface is ultimately procedural.
@everyone else:
The big reason I see for a future refactor to an object-oriented approach is that plots are getting more complicated, and we can’t just keep on adding more methods to the axes object. A more object-oriented approach would allow for complex graphs to be placed into their own modules, and yet still be treated the same as any other plotting method. It would also make it easier for others to extend matplotlib’s plotting features.
Ben Root
···
On Fri, Feb 11, 2011 at 3:06 PM, Ray Speth <speth@…2397…> wrote:
Hi,
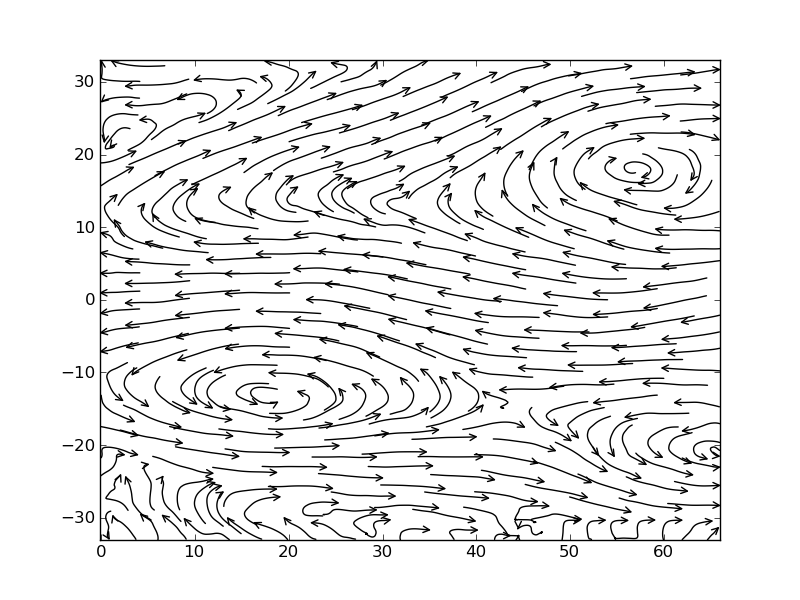
I wrote a script to generate streamline plots using matplotlib a while
ago, and this post inspired me to finally clean it up a bit. The code is
available at http://web.mit.edu/speth/Public/streamlines.py and you can
see an example of its output at
http://web.mit.edu/speth/Public/streamlines.png
I’d be happy to have it find a home in matplotlib if it would be useful
to other people there.
Ray