Annotations with pan / zoom

Hi,

I’ve added annotations to a graph I am producing using matplotlib. The annotations work fine, but when you zoom and pan, the annotations move off the edge of the chart and are still visible while they’re in the main TK window. Does anyone know of a way to make the annotations disappear when they move off the edge of the chart?

Thanks,

Ben

Hi,

I've added annotations to a graph I am producing using matplotlib. The
annotations work fine, but when you zoom and pan, the annotations move off
the edge of the chart and are still visible while they're in the main TK
window. Does anyone know of a way to make the annotations disappear when
they move off the edge of the chart?

Currently, there is no support for this. However, a monkey patching
can be a quick solution for now.

from matplotlib.text import Annotation

def draw(self, renderer):
    x, y = self.xy
    x, y = self._get_xy(x, y, self.xycoords)
    if not self.axes.bbox.contains(x, y):
        return

    self.draw_real(renderer)

Annotation.draw_real = Annotation.draw
Annotation.draw = draw

ann = annotate("test", (0.5, 0.5), xytext=(0.6, 0.6),
               arrowprops=dict(arrowstyle="->"))

I think this should be the default behavior (with optionally turned
off). If other developers don't object, i'll try to push this feature
into the svn.

Regards,

-JJ

···

On Thu, May 14, 2009 at 4:36 AM, Ben Coppin <coppin@...287...> wrote:

Thanks,

Ben

------------------------------------------------------------------------------
The NEW KODAK i700 Series Scanners deliver under ANY circumstances! Your
production scanning environment may not be a perfect world - but thanks to
Kodak, there's a perfect scanner to get the job done! With the NEW KODAK
i700
Series Scanner you'll get full speed at 300 dpi even with all image
processing features enabled. http://p.sf.net/sfu/kodak-com
_______________________________________________
Matplotlib-users mailing list
Matplotlib-users@lists.sourceforge.net
matplotlib-users List Signup and Options

You can’t do this using the existing support for clipping artists? I was planning on cooking up an example that did just that, but haven’t yet found the time.

Ryan

···

On Thu, May 14, 2009 at 2:03 PM, Jae-Joon Lee <lee.j.joon@…287…> wrote:

On Thu, May 14, 2009 at 4:36 AM, Ben Coppin <coppin@…287…> wrote:

Hi,

I’ve added annotations to a graph I am producing using matplotlib. The

annotations work fine, but when you zoom and pan, the annotations move off

the edge of the chart and are still visible while they’re in the main TK

window. Does anyone know of a way to make the annotations disappear when

they move off the edge of the chart?

Currently, there is no support for this. However, a monkey patching

can be a quick solution for now.

from matplotlib.text import Annotation

def draw(self, renderer):

x, y = self.xy

x, y = self._get_xy(x, y, self.xycoords)

if not self.axes.bbox.contains(x, y):

    return


self.draw_real(renderer)

Annotation.draw_real = Annotation.draw

Annotation.draw = draw

ann = annotate(“test”, (0.5, 0.5), xytext=(0.6, 0.6),

           arrowprops=dict(arrowstyle="->"))

I think this should be the default behavior (with optionally turned

off). If other developers don’t object, i’ll try to push this feature

into the svn.


Ryan May
Graduate Research Assistant
School of Meteorology
University of Oklahoma
Sent from Norman, Oklahoma, United States

You can't do this using the existing support for clipping artists? I was
planning on cooking up an example that did just that, but haven't yet found
the time.

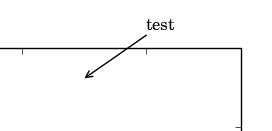
What I want (and what I think is desirable) is that the annotation
should be drawn when (and only when) the xy coordinate is inside the
axes while the annotation text itself still can be outside the axes
(as in the attached image).
So, I don't think clipping is suitable here.

-JJ

a23.png

···

Ryan

--
Ryan May
Graduate Research Assistant
School of Meteorology
University of Oklahoma
Sent from Norman, Oklahoma, United States

You’re right, that makes sense.

Ryan

···

On Thu, May 14, 2009 at 4:58 PM, Jae-Joon Lee <lee.j.joon@…287…> wrote:

You can’t do this using the existing support for clipping artists? I was

planning on cooking up an example that did just that, but haven’t yet found

the time.

What I want (and what I think is desirable) is that the annotation

should be drawn when (and only when) the xy coordinate is inside the

axes while the annotation text itself still can be outside the axes

(as in the attached image).

So, I don’t think clipping is suitable here


Ryan May
Graduate Research Assistant
School of Meteorology

University of Oklahoma

Thanks! As far as I can tell, this works perfectly.

I agree that this should probably be the default behaviour.

Ben

···

On Thu, May 14, 2009 at 8:03 PM, Jae-Joon Lee <lee.j.joon@...287...> wrote:

On Thu, May 14, 2009 at 4:36 AM, Ben Coppin <coppin@...287...> wrote:

Hi,

I've added annotations to a graph I am producing using matplotlib. The
annotations work fine, but when you zoom and pan, the annotations move off
the edge of the chart and are still visible while they're in the main TK
window. Does anyone know of a way to make the annotations disappear when
they move off the edge of the chart?

Currently, there is no support for this. However, a monkey patching
can be a quick solution for now.

from matplotlib.text import Annotation

def draw(self, renderer):
x, y = self.xy
x, y = self._get_xy(x, y, self.xycoords)
if not self.axes.bbox.contains(x, y):
return

self.draw_real(renderer)

Annotation.draw_real = Annotation.draw
Annotation.draw = draw

ann = annotate("test", (0.5, 0.5), xytext=(0.6, 0.6),
arrowprops=dict(arrowstyle="->"))

I think this should be the default behavior (with optionally turned
off). If other developers don't object, i'll try to push this feature
into the svn.

Regards,

-JJ

Thanks,

Ben

------------------------------------------------------------------------------
The NEW KODAK i700 Series Scanners deliver under ANY circumstances! Your
production scanning environment may not be a perfect world - but thanks to
Kodak, there's a perfect scanner to get the job done! With the NEW KODAK
i700
Series Scanner you'll get full speed at 300 dpi even with all image
processing features enabled. http://p.sf.net/sfu/kodak-com
_______________________________________________
Matplotlib-users mailing list
Matplotlib-users@lists.sourceforge.net
matplotlib-users List Signup and Options

Attached is a patch that I want to commit to the trunk.
It introduces new attribute "_check_contains" (any name suggestion?)
for Annotation class.

          * True : the annotation will only be drawn when self.xy is
inside the axes.
          * False : the annotation will always be drawn regardless of
its position.
          * None : the self.xy will be checked only if *xycoords* is "data"

The default value is None, i.e., position is only checked if the
xycoords is "data".

I'll commit this soon if others don't object.
Regards,

-JJ

annotation_check_contains.patch (2.75 KB)

···

On Fri, May 15, 2009 at 3:44 AM, Ben Coppin <coppin@...287...> wrote:

Thanks! As far as I can tell, this works perfectly.

I agree that this should probably be the default behaviour.

Ben

On Thu, May 14, 2009 at 8:03 PM, Jae-Joon Lee <lee.j.joon@...287...> wrote:

On Thu, May 14, 2009 at 4:36 AM, Ben Coppin <coppin@...287...> wrote:

Hi,

I've added annotations to a graph I am producing using matplotlib. The
annotations work fine, but when you zoom and pan, the annotations move off
the edge of the chart and are still visible while they're in the main TK
window. Does anyone know of a way to make the annotations disappear when
they move off the edge of the chart?

Currently, there is no support for this. However, a monkey patching
can be a quick solution for now.

from matplotlib.text import Annotation

def draw(self, renderer):
x, y = self.xy
x, y = self._get_xy(x, y, self.xycoords)
if not self.axes.bbox.contains(x, y):
return

self.draw_real(renderer)

Annotation.draw_real = Annotation.draw
Annotation.draw = draw

ann = annotate("test", (0.5, 0.5), xytext=(0.6, 0.6),
arrowprops=dict(arrowstyle="->"))

I think this should be the default behavior (with optionally turned
off). If other developers don't object, i'll try to push this feature
into the svn.

Regards,

-JJ

Thanks,

Ben

------------------------------------------------------------------------------
The NEW KODAK i700 Series Scanners deliver under ANY circumstances! Your
production scanning environment may not be a perfect world - but thanks to
Kodak, there's a perfect scanner to get the job done! With the NEW KODAK
i700
Series Scanner you'll get full speed at 300 dpi even with all image
processing features enabled. http://p.sf.net/sfu/kodak-com
_______________________________________________
Matplotlib-users mailing list
Matplotlib-users@lists.sourceforge.net
matplotlib-users List Signup and Options

Attached is a patch that I want to commit to the trunk.
It introduces new attribute "_check_contains" (any name suggestion?)

I'm not keen on the name either -- something more explicit would be
better. Maybe, set_annotation_clip or something like that, which is
more descriptive to me.

for Annotation class.

     \* True : the annotation will only be drawn when self\.xy is

inside the axes.
* False : the annotation will always be drawn regardless of
its position.
* None : the self.xy will be checked only if *xycoords* is "data"

The default value is None, i.e., position is only checked if the
xycoords is "data".

I'll commit this soon if others don't object.

You don't need permission :slight_smile: but I took a look at the patch. Inline
comments below

+ def get_check_contains(self):
+ " retrun *check_contains* attribute. "
+ return self._check_contains

···

On Fri, May 15, 2009 at 5:16 PM, Jae-Joon Lee <lee.j.joon@...287...> wrote:
+

retrun is misspelled

+
+
     def update_positions(self, renderer):

+ xy_pixel = self._get_position_xy(renderer)
+ self._update_position_xytext(renderer, xy_pixel)
+
+
+ def _get_position_xy(self, renderer):
+ x, y = self.xy
+ return self._get_xy(x, y, self.xycoords)
+

When you are extending/fixing existing code and come across methods
with no docs, could you write a one or two line doc string for them?
I wrote many of these and at the time they were so obvious that they
didn't need docstrings, but as time passes and I reencounter them, I
wish there was a simple line explaining them. As you are digging
through the code figuring them all out, it is a great time to drop in
a simple one-liner docstring (eg explaining what coord system is being
returned by _get_position_xy). As the famous coding quip says, the
literal wording or author of which I cannot dig up right now, "Leave
comments in your code -- someone may read it someday, and that someone
may be you!"

+ class _SimpleEvent:
+ def __init__(self, xy):
+ self.x, self.y = xy
+
+ def _check_xy(self, renderer, xy_pixel):
+ "given the xy coordinate, check if the annotation need to be drawn"
+
+ b = self.get_check_contains()
+ if b or (b is None and self.xycoords == "data"):
+ # check if self.xy is inside the axes.
+ if not self.axes.contains(Annotation._SimpleEvent(xy_pixel))[0]:
+ return False
+

I'm not wild about this -- I find myself doing similar hacks when
writing GUIs and doing other stuff where the quick-and-dirty is easier
than the right way, but for mpl, which is a library and is growing
rapidly and has already reached the point where no one developer has
their head around the whole thing, I think we need to be careful about
these kinds of hacks that can result in subtle bugs down the road.

You are relying on the event infrastructure API via the Axes.contain
method, but are hacking around it by just providing the minimal set of
things that are needed for the contains call with the _SimpleEvent.
The problem is, if the event API or the contains method changes later,
this is a latent bug which is difficult to unit test since it is
primarily exposed interactively. Axes.contains expects a MouseEvent
according to the signature -- I haven't dug to deeply here but with a
little more work can we provide what it is expecting rather than the
stripped down proxy class (and does "contains" really need a
MouseEvent or would a LocationEvent would suffice -- this may be
simply a matter of renaming the arg to contains....). Or perhaps the
Axes.contains method itself is misguided, requiring a full-fledged
event when an x/y location would suffice. If it is fairly easy, I
would like to fix this here and now rather than hack around a bad
design decision.

Thanks for the patch!
JDH
Sure, I'll keep that in mind.
I'll revise the patch (I'll also think about the contains method) and
submit it soon.
Thanks,

-JJ

···

On Fri, May 15, 2009 at 10:02 PM, John Hunter <jdh2358@...287...> wrote:

When you are extending/fixing existing code and come across methods
with no docs, could you write a one or two line doc string for them?
I wrote many of these and at the time they were so obvious that they
didn't need docstrings, but as time passes and I reencounter them, I
wish there was a simple line explaining them. As you are digging
through the code figuring them all out, it is a great time to drop in
a simple one-liner docstring (eg explaining what coord system is being
returned by _get_position_xy). As the famous coding quip says, the
literal wording or author of which I cannot dig up right now, "Leave
comments in your code -- someone may read it someday, and that someone
may be you!"

Sure, I'll keep that in mind.
I'll revise the patch (I'll also think about the contains method) and
submit it soon.
Thanks,

-JJ

The patch is now committed to svn with relevant changes (r7119).

-JJ