So I have been trying for a while to get my annotation to lay over the y axis on the right using zordering. But have had no luck in finding a solution.
My Chart currently looks like the following:
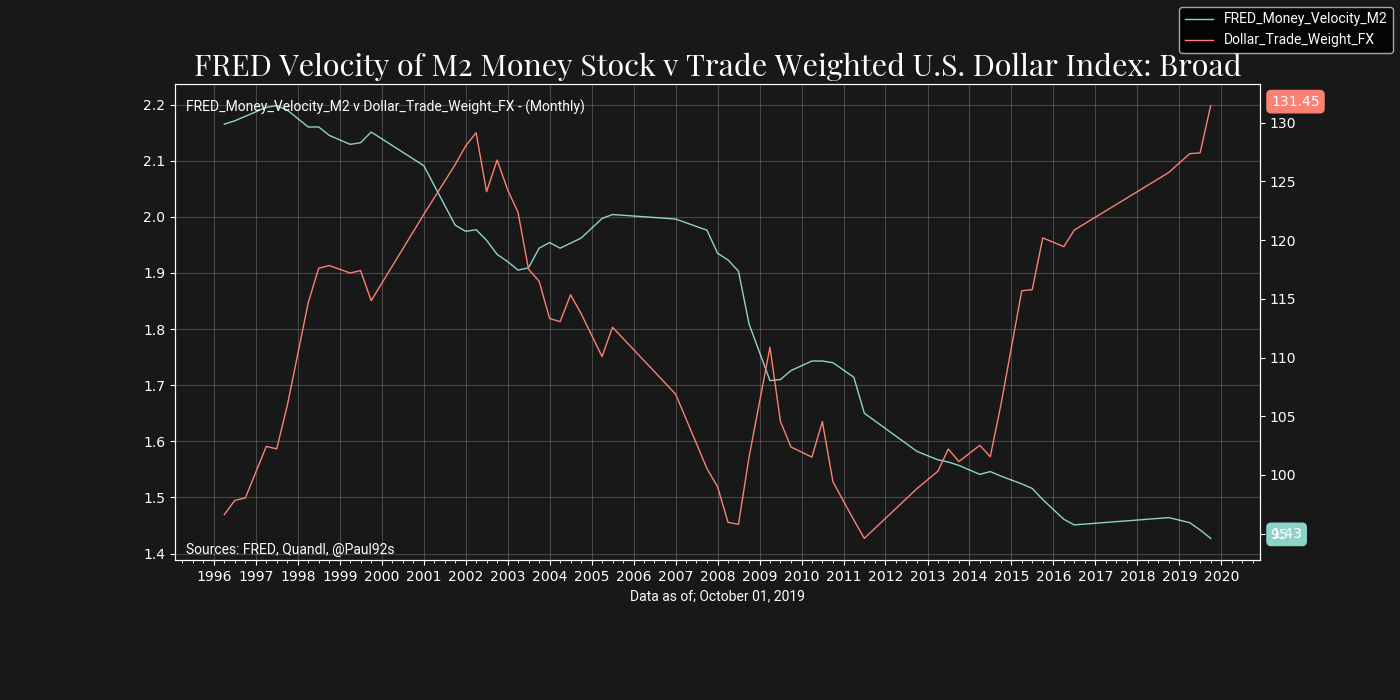
As you may see in on the right the the text from the y axis is visible on the annotation. I am not sure where I have went wrong here.
But the aim is to create something to look like the following:
https://imgur.com/a/BeL9UIk (Sorry about link could only upload one image)
plt.style.use('dark_background')


ax = df.plot(x=df.columns[0], y=df.columns[1], legend=False, zorder=0, linewidth=1)
y1 =df.loc[:, df.columns[2]].tail(1)
y2= df.loc[:, df.columns[1]].tail(1)


colors = plt.rcParams["axes.prop_cycle"].by_key()["color"]
print(colors)
for var in (y1, y2):
    ax.annotate('%0.2f' % var.max(), xy=(1, var.max()), zorder=9, xytext=(8, 0),
                 xycoords=('axes fraction', 'data'),
                 textcoords='offset points',
                 bbox=dict(boxstyle="round", fc=colors[0], ec=colors[0], zorder=9))


ax.set_axisbelow(True)
ax2 = ax.twinx()
df.plot(x=df.columns[0], y=df.columns[2], ax=ax2, legend=False, color='#fa8174', zorder=-1,linewidth=1)


ax.figure.legend(prop=subtitle_font)
ax.grid(True, color="white",alpha=0.2, zorder=0)

pack = [df.columns[1], df.columns[2], freq[0]]
plt.text(0.01, 0.95,'{0} v {1} - ({2})'.format(df.columns[1], df.columns[2], freq[0]),
     horizontalalignment='left',
     verticalalignment='center',
     transform = ax.transAxes,
     zorder=10,
     fontproperties=subtitle_font)

ax.text(0.01,0.02,"Sources: FRED, Quandl, @Paul92s",
	color="white",fontsize=10,
	horizontalalignment='left',
	transform = ax.transAxes,
     verticalalignment='center',
     zorder=20,
     fontproperties=subtitle_font)

ax.xaxis.set_major_locator(matplotlib.dates.YearLocator())
ax.xaxis.set_minor_locator(matplotlib.dates.MonthLocator((4,7,10)))
ax.xaxis.set_major_formatter(matplotlib.dates.DateFormatter("%Y"))
ax.xaxis.set_minor_formatter(ticker.NullFormatter()) # matplotlib.dates.DateFormatter("%m")
plt.setp(ax.get_xticklabels(), rotation=0, ha="center", zorder=-1)
plt.setp(ax2.get_yticklabels(), rotation=0, zorder=-1)
plt.setp(ax.get_yticklabels(), rotation=0, zorder=-1)
plt.gcf().set_size_inches(14,7)
ax.set_xlabel('Data as of; {0}'.format(df['Date'].max().strftime("%B %d, %Y")), fontproperties=subtitle_font)


y1 =df.loc[:, df.columns[2]].tail(1)
y2= df.loc[:, df.columns[1]].tail(1)

for var in (y1, y2):
    ax2.annotate('%0.2f' % var.max(), xy=(1, var.max()), zorder=9,xytext=(8, 0),
                 xycoords=('axes fraction', 'data'),
                 textcoords='offset points',
                 bbox=dict(boxstyle="round", fc="#fa8174", ec="#fa8174", zorder=3), annotation_clip=False)

ax.set_axisbelow(True)
ax2.set_axisbelow(True)

plt.title('{0}'.format("FRED Velocity of M2 Money Stock v Trade Weighted U.S. Dollar Index: Broad"),fontproperties=heading_font)
ax2.texts.append(ax2.texts.pop())
ax.set_facecolor('#181818')
ax.figure.set_facecolor('#181818')


ax.get_figure().savefig(r'C:/Users/yr193xz/OneDrive - EY/Desktop/chart_output3.png', facecolor=ax.get_facecolor())
plt.show()