I just seem to break things…
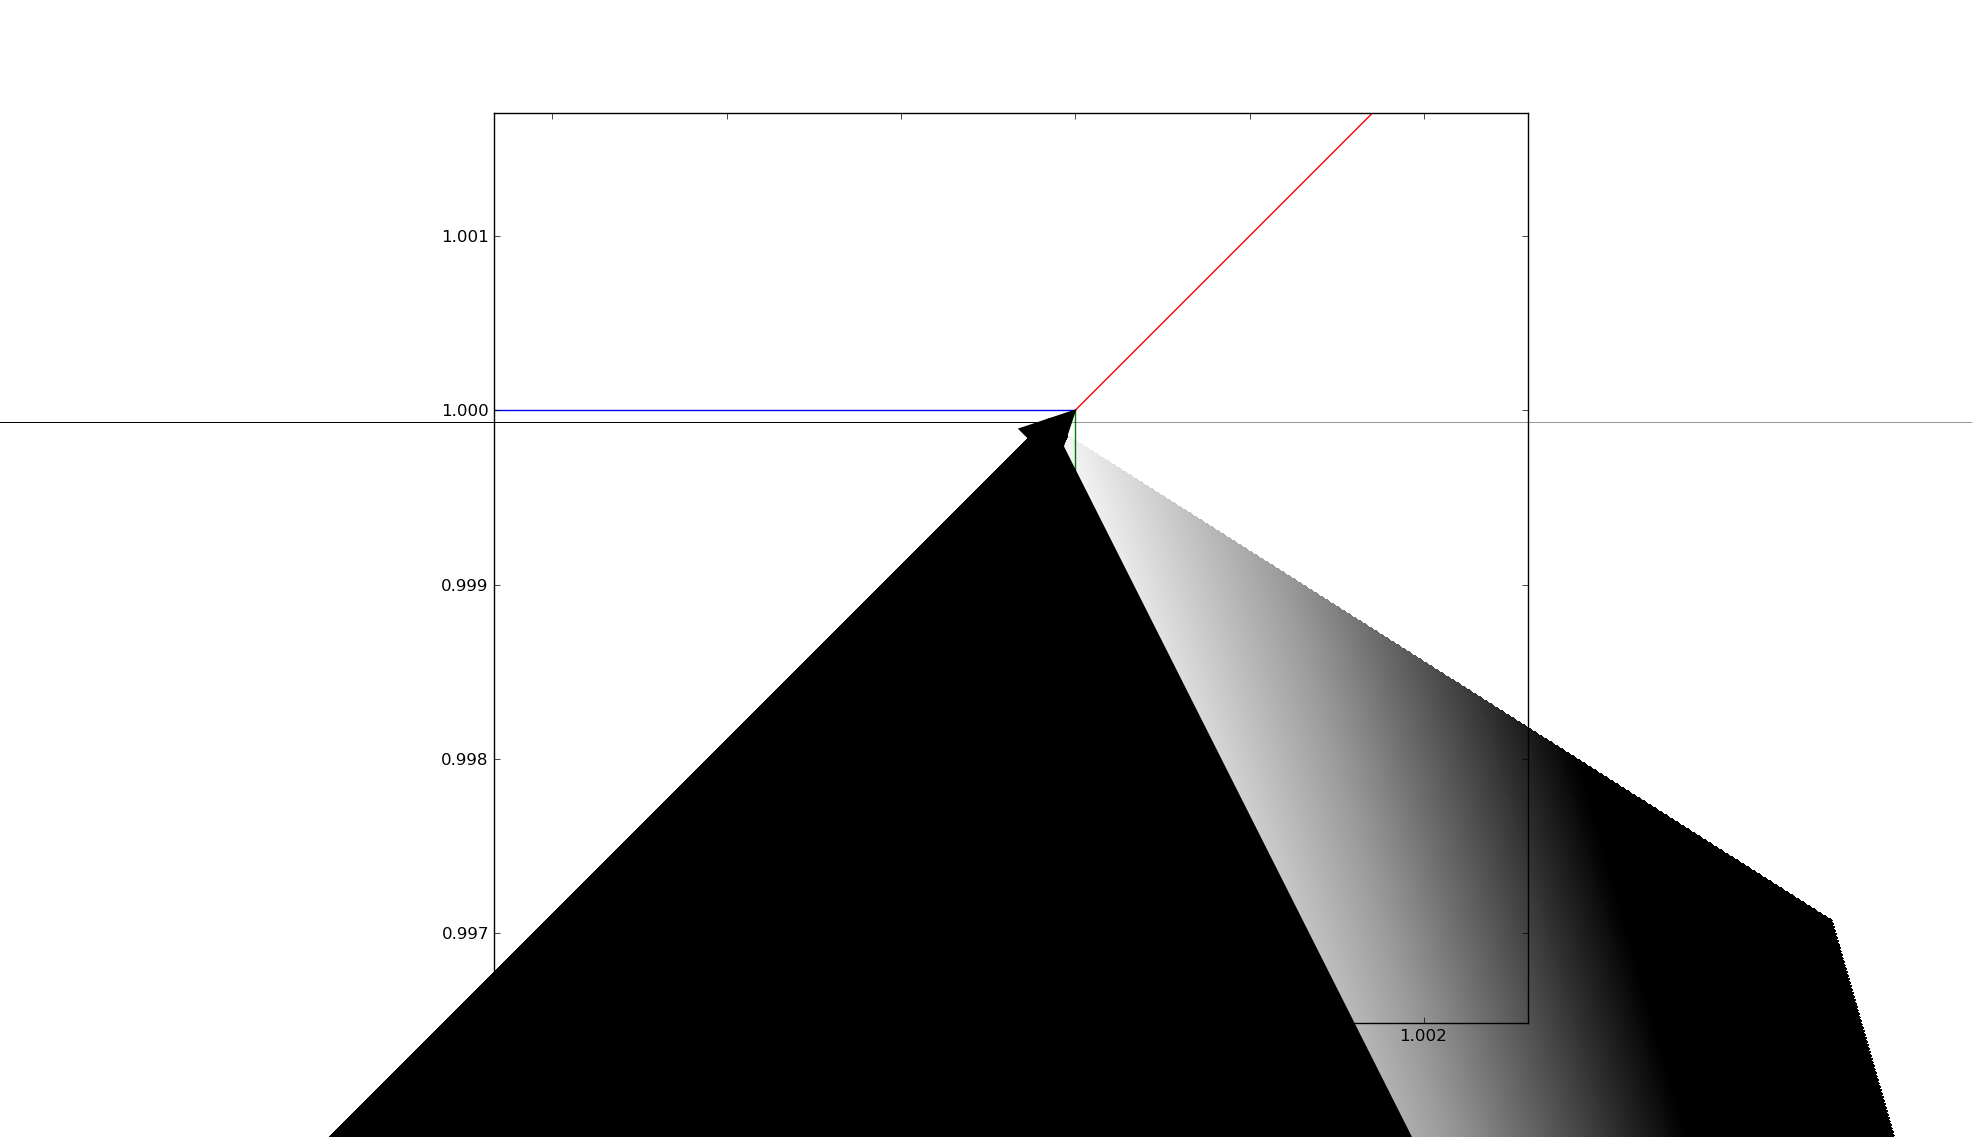
I am not 100% sure if the tip is placed correctly, but it does appear much better than before. I now see a tiny bit of the red line southwest of the vertex. Before, the issue was that the arrow tip was northeast of the vertex. In addition, I found that I was still able to produce the distortion after zooming in sufficiently (it took a few extra zooms to make it happen).
I then did one more zoom, and then tried resizing the window, and I think I broke the Agg renderer. Two exceptions were raised. First, an overflow error occurred while rendering the path (complexity exceeded). Then, an “SystemError: error return without exception set” exception was raised from the same spot. I am wondering if zooming into the arrow distortion and/or resizing the figure window triggered the complexity issue, and then the error handling routines weren’t properly handling the raised exception. Here was my traceback:
Traceback (most recent call last):
File “/home/bvr/Programs/matplotlib/matplotlib/lib/matplotlib/backends/backend_gtk.py”, line 394, in expose_event
self._render_figure(self._pixmap, w, h)
File “/home/bvr/Programs/matplotlib/matplotlib/lib/matplotlib/backends/backend_gtkagg.py”, line 75, in _render_figure
FigureCanvasAgg.draw(self)
File “/home/bvr/Programs/matplotlib/matplotlib/lib/matplotlib/backends/backend_agg.py”, line 394, in draw
self.figure.draw(self.renderer)
File “/home/bvr/Programs/matplotlib/matplotlib/lib/matplotlib/artist.py”, line 55, in draw_wrapper
draw(artist, renderer, *args, **kwargs)
File “/home/bvr/Programs/matplotlib/matplotlib/lib/matplotlib/figure.py”, line 874, in draw
func(*args)
File “/home/bvr/Programs/matplotlib/matplotlib/lib/matplotlib/artist.py”, line 55, in draw_wrapper
draw(artist, renderer, *args, **kwargs)
File “/home/bvr/Programs/matplotlib/matplotlib/lib/matplotlib/axes.py”, line 1954, in draw
a.draw(renderer)
File “/home/bvr/Programs/matplotlib/matplotlib/lib/matplotlib/artist.py”, line 55, in draw_wrapper
draw(artist, renderer, *args, **kwargs)
File “/home/bvr/Programs/matplotlib/matplotlib/lib/matplotlib/text.py”, line 1986, in draw
self.arrow_patch.draw(renderer)
File “/home/bvr/Programs/matplotlib/matplotlib/lib/matplotlib/patches.py”, line 3930, in draw
path_effect.draw_path(renderer, gc, p, affine, None)
File “/home/bvr/Programs/matplotlib/matplotlib/lib/matplotlib/patheffects.py”, line 121, in draw_path
renderer.draw_path(gc0, tpath, affine, None)
File “/home/bvr/Programs/matplotlib/matplotlib/lib/matplotlib/backends/backend_agg.py”, line 117, in draw_path
self._renderer.draw_path(gc, path, transform, rgbFace)
OverflowError: Agg rendering complexity exceeded. Consider downsampling or decimating your data.
Traceback (most recent call last):
File “/home/bvr/Programs/matplotlib/matplotlib/lib/matplotlib/backends/backend_gtk.py”, line 394, in expose_event
self._render_figure(self._pixmap, w, h)
File “/home/bvr/Programs/matplotlib/matplotlib/lib/matplotlib/backends/backend_gtkagg.py”, line 75, in _render_figure
FigureCanvasAgg.draw(self)
File “/home/bvr/Programs/matplotlib/matplotlib/lib/matplotlib/backends/backend_agg.py”, line 394, in draw
self.figure.draw(self.renderer)
File “/home/bvr/Programs/matplotlib/matplotlib/lib/matplotlib/artist.py”, line 55, in draw_wrapper
draw(artist, renderer, *args, **kwargs)
File “/home/bvr/Programs/matplotlib/matplotlib/lib/matplotlib/figure.py”, line 814, in draw
if self.frameon: self.patch.draw(renderer)
File “/home/bvr/Programs/matplotlib/matplotlib/lib/matplotlib/artist.py”, line 55, in draw_wrapper
draw(artist, renderer, *args, **kwargs)
File “/home/bvr/Programs/matplotlib/matplotlib/lib/matplotlib/patches.py”, line 411, in draw
renderer.draw_path(gc, tpath, affine, rgbFace)
File “/home/bvr/Programs/matplotlib/matplotlib/lib/matplotlib/backends/backend_agg.py”, line 117, in draw_path
self._renderer.draw_path(gc, path, transform, rgbFace)
SystemError: error return without exception set
···
On Tue, Nov 9, 2010 at 8:44 PM, Jae-Joon Lee <lee.j.joon@…287…> wrote:
On Wed, Nov 10, 2010 at 1:01 AM, Jason Grout > <jason-sage@…120…2130…> wrote:
Is the tip of the arrow (after the miter join) supposed to hit (1,1), or is
the center of the line supposed to hit (1,1)? Or maybe the tip of the
joinstyle=‘round’ arrow (the default) is supposed to hit (1,1)?
The tip of the arrow is meant to hit (1,1), which is done by the
underlying arrow class adjusting the end point of the path during the
drawing time. This only happens for arrowstyle “->” and etc.
However, there was an incorrect arithmetic which I think is fixed now.
The patch is attached (it also fixes dpi-related issues).
I’m not sure it would be better if this could be optionally turned
off. Any suggestion?
Let me know of any (persisting or other) issues.
FYI, path is shortened by small amount by default. This is controlled
by shrink parameter (shrinkA and shrinkB shortens the line begin and
the line end respectively.)
aa = ax.annotate(‘’, (1,1), (0,0),
             arrowprops=dict(arrowstyle="-|>",

                             fc="k", ec="k",lw=50,

                             shrinkB=0,

                             path_effects=[Stroke(joinstyle='miter')]

                             )
Also, I noticed that the arrow head is not correctly filled when
      path_effects are in use. This is now fixed.


      Regards,


        -JJ