I’m very pleased to make the inaugural announcement of a project I’ve been involved in to deliver some new mapping capabilities in Python, using matplotlib. We’re keen to make an announcement on this while it is still in an embryonic stage so that anyone with an interest in mapping can get involved and make a real difference to the overall quality and design of the package. Some more information:
Cartopy - a Python package harnessing the power of matplotlib to deliver informative, precise and striking maps.
Matplotlib is already blessed with a mapping library (Basemap) which beats most of its rivals for functionality, but there are some core problems with its architecture which prohibit easy expansion to support some valuable use cases.
Cartopy is a package, written from the ground up, which moves to address these use cases - and attempts to make it easy for further expansion for future use cases. Some of the core features of cartopy include:
About
···
- object oriented projection definitions
- point, line, polygon and image transformations between projections (forget your dateline woes - it should “just work”)
- integration to expose advanced mapping in matplotlib with a simple and intuitive interface
- work-in-progress mechanisms for accessing specialist data such as those from the “Shuttle Radar Topography Mission” (SRTM) and the “Global Self-consistent, Hierarchical, High-resolution Shoreline” database (GSHHS).
Cartopy, available under the GNU LGPL3 license, is in an early stage of development and is currently feature deficient when compared to Basemap (e.g. no work on vector plotting has yet been done). However, it is our belief that the object oriented approach that cartopy has taken will allow it to grow quickly and easily to blossom into a powerful tool for geospatial visualisations.
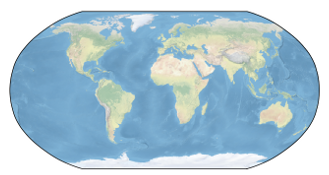
A simple example of a cartopy with a standard background image (result attached):
import cartopy.crs as ccrs
import matplotlib.pyplot as plt
ax = plt.axes(projection=ccrs.Robinson())
ax.stock_img()
plt.show()
More examples and documentation for the cartopy project can be found at http://scitools.org.uk/cartopy (latest docs http://scitools.org.uk/cartopy/docs/latest/).
Our ambition is to see a killer mapping library for matplotlib which builds upon the great work that has already been done hitherto in Basemap, with some key functional, architectural and paradigm changes to make it easier to extend. As such, we have started cartopy development from the ground up, with a close eye on some of the fantastic functionality (and implementations) that Basemap already delivers.
The plan is to take a leaf out of Pandas’ book and use Stack Overflow as the primary user question & answer site (http://stackoverflow.com/questions/tagged/cartopy) rather than having a user’s mailing list. Given cartopy’s tight coupling to matplotlib, unless there are any objections, I think it would make sense to use the matplotlib-devel mailing list for development communications to start with (perhaps prefix the subject with "Cartopy: "), if it becomes too noisy on the matplotlib-devel mailing list, a new list can be created easily enough. Please shout if this is not an acceptable use of the mpl-devel mailing list.
If you are interested in getting involved, or are having any problems with installing/bugs, please let us know (email, mpl-devel mailing list, github issue tracker or Stack Overflow) - we would love to get your feedback, and hopefully, your contributions too!
Thanks and happy mapping!
Phil Elson