alternative to show()? too many figures

Dear ones, I discovered Matplotlit only yesterday, and it's

    > great. But I've got one problem. Since I am using the GTK
    > backend, I have to use the show() function. But I have
    > hundreds of figures and each to be written into a file. If I
    > put the show() at the end of my program, the machine just
    > can't handle it. If I put the show() in a loop, then I have
    > close the hundreds of picture windows by hand. Is there a
    > solution to this problem?

Yes, you want to use the Agg backend for bulk pure image generation.
You don't need to use show and no GUI pops up.

You can specify Agg from the command line by doing

  > python myscript.py -dAgg

Or from within your script by doing

    import matplotlib
    matplotlib.use('Agg')
    from matplotlib.matlab import *

    plot([1,2,3])
    savefig('myfile')

Agg provides PNG output, which in my opinion is superior to jpeg for
line art.

These issues are covered in the FAQ, especially "Can I just generate
images without having a window popup?"

  http://matplotlib.sourceforge.net/faq.html

You should probably also check out

  http://matplotlib.sourceforge.net/tutorial.html

and

  http://matplotlib.sourceforge.net/backends.html

Good luck!
JDH
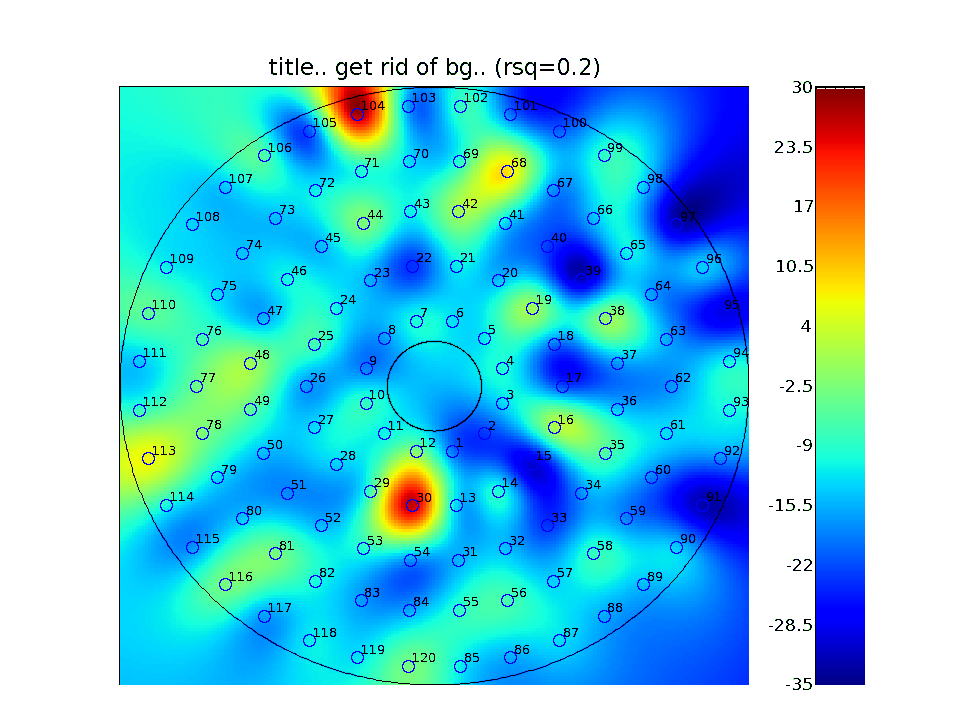
Hi:

I attach a pcolor plot. I would like to get rid of the areas outside the larger circle and inside the smaller circle. Ideally I would like them to be white. Currently I create my plot using pcolor and then plot *lots* of white circles (for the inside) and lines (for the outside) on top, to get rid of the unwanted areas. This works but I wonder whether there is a better/faster solution. I would imagine I could set the values corresponding to the unwanted areas to some particular color before I call pcolor, but the issue is that I want those ares to be white (or other color not included in the standard palette which is used for plotting the area inside the annulus). Can this be done?

Another question is in regards to showing tics in pcolor plots. In my "legend" on the right, I would like them to be visible, but they get overwritten. I suppose I could plot each manually after I do pcolor; is it how this is meant to be done?

Thanks

m1MQLarge.png

···

--
Peter Groszkowski Gemini Observatory
Tel: +1 808 974-2509 670 N. A'ohoku Place
Fax: +1 808 935-9235 Hilo, Hawai'i 96720, USA