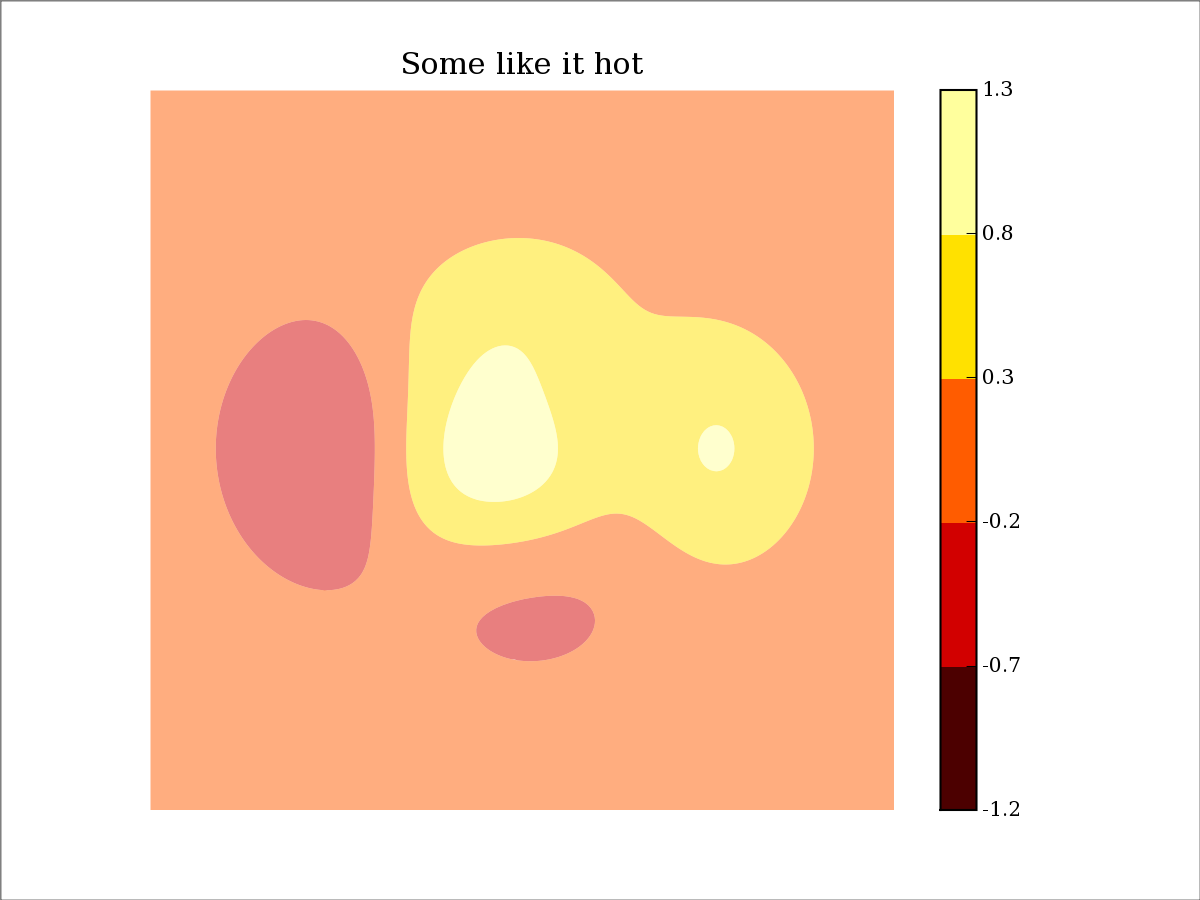
When I use contourf with an alpha argument and the “hot” color scheme. The alpha causes the colors to come out lighter but the colorbar does not adjust accordingly. Is this a bug or do I simply need to adjust the colorbar in some manner?
Below is an adaptation of pcolor.py from the screenshots page and attached is the output I see.
I am using matplotlib 0.87.7:
In [3]: matplotlib.version
Out[3]: ‘0.87.7’
···
from future import division
from pylab import *
def func3(x,y):
return (1- x/2 + x5 + y3)*exp(-x2-y2)
dx, dy = 0.025, 0.025
x = arange(-3.0, 3.0, dx)
y = arange(-3.0, 3.0, dy)
X,Y = meshgrid(x, y)
Z = func3(X, Y)
cset = contourf(Z, arange(-1.2,1.6,0.5),
origin=‘lower’,
extent=(-3,3,-3,3), alpha=.5
)
axis(‘off’)
hot()
colorbar()
title(‘Some like it hot’)
show(‘example’)
Tom,
This is a bug. It looks like I completely forgot about handling alpha when I rewrote the colorbar code. I will try to get it fixed in the next few days. Thanks for the report.
Eric
Tom Denniston wrote:
···
When I use contourf with an alpha argument and the "hot" color scheme. The alpha causes the colors to come out lighter but the colorbar does not adjust accordingly. Is this a bug or do I simply need to adjust the colorbar in some manner?
I am using matplotlib 0.87.7:
In [3]: matplotlib.__version__
Out[3]: '0.87.7'
--------------------------------------------------
from __future__ import division
from pylab import *
def func3(x,y):
return (1- x/2 + x**5 + y**3)*exp(-x**2-y**2)
dx, dy = 0.025, 0.025
x = arange(-3.0, 3.0, dx)
y = arange(-3.0, 3.0, dy)
X,Y = meshgrid(x, y)
Z = func3(X, Y)
cset = contourf(Z, arange(-1.2,1.6,0.5),
origin='lower',
extent=(-3,3,-3,3), alpha=.5
)
axis('off')
hot()
colorbar()
title('Some like it hot')
show('example')
------------------------------------------------------------------------
------------------------------------------------------------------------
-------------------------------------------------------------------------
Using Tomcat but need to do more? Need to support web services, security?
Get stuff done quickly with pre-integrated technology to make your job easier
Download IBM WebSphere Application Server v.1.0.1 based on Apache Geronimo
http://sel.as-us.falkag.net/sel?cmd=lnk&kid=120709&bid=263057&dat=121642
------------------------------------------------------------------------
_______________________________________________
Matplotlib-users mailing list
Matplotlib-users@lists.sourceforge.net
matplotlib-users List Signup and Options