I posted a related question on stackoverflow
(http://stackoverflow.com/questions/15815862/apply-affine-transform-to-quiver-in-python-matplotlib)
but I've produced a simple enough example with strange results that I
think it merits attention here. I'm trying to apply affine transforms
to quiver and scatter plots. In all cases that I've considered, the
scatter and quiver plots transform opposite the regular plot. Here's
a minimal case:
import matplotlib as mpl
from pylab import figure, subplot, plot, scatter, show, axis
figure()
ax = subplot(111)
base_trans = ax.transData
tr = mpl.transforms.Affine2D(matrix =
array([[1,1,0],[0,1,0],[0,0,1]])) + base_trans
plot( [1,2,3], [1,2,3], 'k.', transform = tr )
scatter( [1,2,3], [1,2,3], c = 'k', marker = 'D', transform = tr )
axis([0,7,0,7])
show()
Thanks,
Derek
Hi Derek,
What are we looking at here?
The following code:
import matplotlib.pyplot as plt
import matplotlib.transforms as mtrans
import numpy as np
plt.figure()
ax = plt.subplot(111)
base_trans = ax.transData
mtx = np.array([[1,1,0],
[0,1,0],
[0,0,1]])
tr = mtrans.Affine2D(matrix=mtx) + base_trans
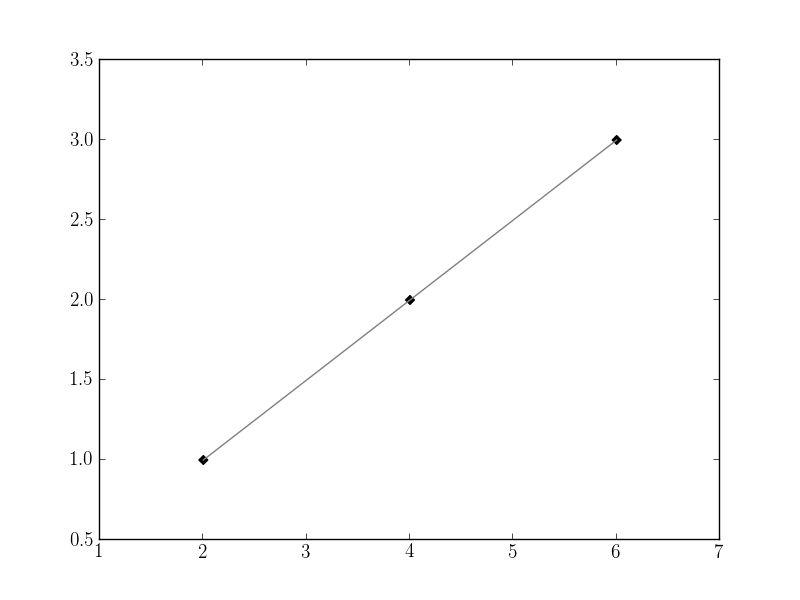
plt.plot([1,2,3], [1,2,3], ‘gray’, transform=tr)
plt.scatter([1,2,3], [1,2,3], c=‘k’, marker=‘D’, transform=tr)
plt.show()
produces the following plot on v1.2.0:
Is this unexpected or are you getting a different result to me?
Regards,
···
On 4 April 2013 17:06, Derek Thomas <derekcthomas@…287…> wrote:
I posted a related question on stackoverflow
(http://stackoverflow.com/questions/15815862/apply-affine-transform-to-quiver-in-python-matplotlib)
but I’ve produced a simple enough example with strange results that I
think it merits attention here. I’m trying to apply affine transforms
to quiver and scatter plots. In all cases that I’ve considered, the
scatter and quiver plots transform opposite the regular plot. Here’s
a minimal case:
import matplotlib as mpl
from pylab import figure, subplot, plot, scatter, show, axis
figure()
ax = subplot(111)
base_trans = ax.transData
tr = mpl.transforms.Affine2D(matrix =
array([[1,1,0],[0,1,0],[0,0,1]])) + base_trans
plot( [1,2,3], [1,2,3], ‘k.’, transform = tr )
scatter( [1,2,3], [1,2,3], c = ‘k’, marker = ‘D’, transform = tr )
axis([0,7,0,7])
show()
Thanks,
Derek
Minimize network downtime and maximize team effectiveness.
Reduce network management and security costs.Learn how to hire
the most talented Cisco Certified professionals. Visit the
Employer Resources Portal
http://www.cisco.com/web/learning/employer_resources/index.html
Matplotlib-users mailing list
Matplotlib-users@lists.sourceforge.net
https://lists.sourceforge.net/lists/listinfo/matplotlib-users
I get a different result.
···
On Thu, Apr 4, 2013 at 9:25 AM, Phil Elson <pelson.pub@…287…> wrote:
Hi Derek,
What are we looking at here?
The following code:
import matplotlib.pyplot as plt
import matplotlib.transforms as mtrans
import numpy as np
plt.figure()
ax = plt.subplot(111)
base_trans = ax.transData
mtx = np.array([[1,1,0],
[0,1,0],
[0,0,1]])
tr = mtrans.Affine2D(matrix=mtx) + base_trans
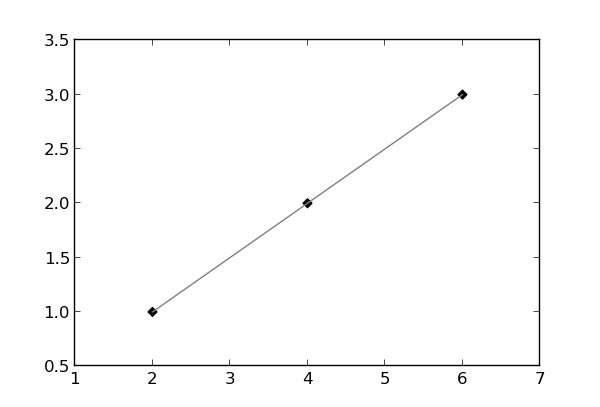
plt.plot([1,2,3], [1,2,3], ‘gray’, transform=tr)
plt.scatter([1,2,3], [1,2,3], c=‘k’, marker=‘D’, transform=tr)
plt.show()
produces the following plot on v1.2.0:
Is this unexpected or are you getting a different result to me?
Regards,
On 4 April 2013 17:06, Derek Thomas <derekcthomas@…287…> wrote:
I posted a related question on stackoverflow
(http://stackoverflow.com/questions/15815862/apply-affine-transform-to-quiver-in-python-matplotlib)
but I’ve produced a simple enough example with strange results that I
think it merits attention here. I’m trying to apply affine transforms
to quiver and scatter plots. In all cases that I’ve considered, the
scatter and quiver plots transform opposite the regular plot. Here’s
a minimal case:
import matplotlib as mpl
from pylab import figure, subplot, plot, scatter, show, axis
figure()
ax = subplot(111)
base_trans = ax.transData
tr = mpl.transforms.Affine2D(matrix =
array([[1,1,0],[0,1,0],[0,0,1]])) + base_trans
plot( [1,2,3], [1,2,3], ‘k.’, transform = tr )
scatter( [1,2,3], [1,2,3], c = ‘k’, marker = ‘D’, transform = tr )
axis([0,7,0,7])
show()
Thanks,
Derek
Minimize network downtime and maximize team effectiveness.
Reduce network management and security costs.Learn how to hire
the most talented Cisco Certified professionals. Visit the
Employer Resources Portal
http://www.cisco.com/web/learning/employer_resources/index.html
Matplotlib-users mailing list
Matplotlib-users@lists.sourceforge.net
https://lists.sourceforge.net/lists/listinfo/matplotlib-users
I’ve been seeing some discrepancy between display and saved figures. See attached. One is the result of the save, the other is the screen capture of the display. I’m using 1.2.0 on a mac.
grab.tiff (53.2 KB)
···
On Thu, Apr 4, 2013 at 9:46 AM, Derek Thomas <derekcthomas@…287…> wrote:
I get a different result.
On Thu, Apr 4, 2013 at 9:25 AM, Phil Elson <pelson.pub@…287…> wrote:
Hi Derek,
What are we looking at here?
The following code:
import matplotlib.pyplot as plt
import matplotlib.transforms as mtrans
import numpy as np
plt.figure()
ax = plt.subplot(111)
base_trans = ax.transData
mtx = np.array([[1,1,0],
[0,1,0],
[0,0,1]])
tr = mtrans.Affine2D(matrix=mtx) + base_trans
plt.plot([1,2,3], [1,2,3], ‘gray’, transform=tr)
plt.scatter([1,2,3], [1,2,3], c=‘k’, marker=‘D’, transform=tr)
plt.show()
produces the following plot on v1.2.0:
Is this unexpected or are you getting a different result to me?
Regards,
On 4 April 2013 17:06, Derek Thomas <derekcthomas@…287…> wrote:
I posted a related question on stackoverflow
(http://stackoverflow.com/questions/15815862/apply-affine-transform-to-quiver-in-python-matplotlib)
but I’ve produced a simple enough example with strange results that I
think it merits attention here. I’m trying to apply affine transforms
to quiver and scatter plots. In all cases that I’ve considered, the
scatter and quiver plots transform opposite the regular plot. Here’s
a minimal case:
import matplotlib as mpl
from pylab import figure, subplot, plot, scatter, show, axis
figure()
ax = subplot(111)
base_trans = ax.transData
tr = mpl.transforms.Affine2D(matrix =
array([[1,1,0],[0,1,0],[0,0,1]])) + base_trans
plot( [1,2,3], [1,2,3], ‘k.’, transform = tr )
scatter( [1,2,3], [1,2,3], c = ‘k’, marker = ‘D’, transform = tr )
axis([0,7,0,7])
show()
Thanks,
Derek
Minimize network downtime and maximize team effectiveness.
Reduce network management and security costs.Learn how to hire
the most talented Cisco Certified professionals. Visit the
Employer Resources Portal
http://www.cisco.com/web/learning/employer_resources/index.html
Matplotlib-users mailing list
Matplotlib-users@lists.sourceforge.net
https://lists.sourceforge.net/lists/listinfo/matplotlib-users
Derek,
I just tried Phil's version of the code on my Mac (MP 1.2.0), and I see exactly the same problem as in your grab.tiff. This is using the default TkAgg backend.
I happen to have built MP 1.2.0 with the Qt4 backend option. When I prepend the lines
from matplotlib import use

use("QT4Agg")
to use Qt4, I get the expected (correct) display output.
Apparently this is a bug somewhere in the chain TkAgg/Tkinter/Tk.
John
···
On 2013-04-04, at 10:51 AM, Derek Thomas wrote:
...screen capture of the display...
<grab.tiff>
Thanks Derek & John.
Very strange. Here’s my setup:
import matplotlib
matplotlib.version
‘1.2.0’
matplotlib.get_backend()
‘TkAgg’
Would you mind providing all of the relevant details suggested in http://matplotlib.org/faq/troubleshooting_faq.html#troubleshooting, along with the code to reproduce the problem in a new github issue?
Once I have all of the necessary details, I’d be happy to have a look into this to see if I can find a solution.
Cheers,
Phil
···
On 5 April 2013 02:02, John Gleeson <jdgleeson@…935…> wrote:
On 2013-04-04, at 10:51 AM, Derek Thomas wrote:
…screen capture of the display…
<grab.tiff>
Derek,
I just tried Phil’s version of the code on my Mac (MP 1.2.0), and I see exactly the same problem as in your grab.tiff. This is using the default TkAgg backend.
I happen to have built MP 1.2.0 with the Qt4 backend option. When I prepend the lines
from matplotlib import use
use("QT4Agg")
to use Qt4, I get the expected (correct) display output.
Apparently this is a bug somewhere in the chain TkAgg/Tkinter/Tk.
John
Here's the output. I'm running OS X 10.8.3. I installed matplotlib
from homebrew.
$HOME=/Users/dect
CONFIGDIR=/Users/dect/.matplotlib
matplotlib data path /usr/local/lib/python2.7/site-packages/matplotlib/mpl-data
loaded rc file /usr/local/lib/python2.7/site-packages/matplotlib/mpl-data/matplotlibrc
matplotlib version 1.2.0
verbose.level helpful
interactive is False
platform is darwin
Using fontManager instance from /Users/dect/.matplotlib/fontList.cache
backend MacOSX version unknown
mpl.__file__
'/usr/local/lib/python2.7/site-packages/matplotlib/__init__.pyc'
mpl.get_backend()
'MacOSX'
mpl.__version__
'1.2.0'
mpl.get_configdir()
'/Users/dect/.matplotlib'
···
On Fri, Apr 5, 2013 at 2:07 AM, Phil Elson <pelson.pub@...287...> wrote:
Thanks Derek & John.
Very strange. Here's my setup:
import matplotlib
matplotlib.__version__
'1.2.0'
matplotlib.get_backend()
'TkAgg'
Would you mind providing all of the relevant details suggested in
http://matplotlib.org/faq/troubleshooting_faq.html#troubleshooting, along
with the code to reproduce the problem in a new github issue?
Once I have all of the necessary details, I'd be happy to have a look into
this to see if I can find a solution.
Cheers,
Phil
On 5 April 2013 02:02, John Gleeson <jdgleeson@...935...> wrote:
On 2013-04-04, at 10:51 AM, Derek Thomas wrote:
...screen capture of the display...
<grab.tiff>
Derek,
I just tried Phil's version of the code on my Mac (MP 1.2.0), and I see
exactly the same problem as in your grab.tiff. This is using the default
TkAgg backend.
I happen to have built MP 1.2.0 with the Qt4 backend option. When I
prepend the lines
from matplotlib import use
use("QT4Agg")
to use Qt4, I get the expected (correct) display output.
Apparently this is a bug somewhere in the chain TkAgg/Tkinter/Tk.
John
Phil and Derek,
I just created this as the following issue
https://github.com/matplotlib/matplotlib/issues/1886
I was wrong about TkAgg having a problem. The default backend for Derek and me is MacOSX. Both TkAgg and QT4Agg display correctly for me.
John