Hi Ekrem,
From the sounds of it, you're creating a stratigraphic column. It sounds
you already have numerical values that correspond to lithology (or
something similar).
There's more than one way to approach this problem. Which way is best will
depend on what you're doing, but here's one example.
import numpy as np
import matplotlib.pyplot as plt
from matplotlib.colors import from_levels_and_colors
# Tops and base of section (7 values)
tops = np.array([780, 820, 850, 900, 910, 1000])
# Lithology in each interval (6 values)
lith = np.array([1, 3, 2, 3, 2, 1])
# Left and right x-location of strat column
x = np.array([0, 20])
# Set up a colormap and normalization instance to tie the intervals:
# [1, 2) -> lightblue
# [2, 3) -> yellow
# [3, 4) -> brown
cmap, norm = from_levels_and_colors([1, 2, 3, 4],
['lightblue', 'yellow', 'saddlebrown'])
# Set up the figure with one axes
fig, ax = plt.subplots()
# We'll need the x, y, and z arrays to be 2D to use them with
pcolor/pcolormesh.
# Currently, they're 1D. Therefore, we'll add an axis to each by slicing
with
# None. Also, we'll use the colormap and norm we created earlier.
ax.pcolormesh(x[None,:], tops[:,None], lith[:,None], cmap=cmap, norm=norm)
# Optional, but to approriate for this situation...
ax.set(xticks=, title='Stratigraphic Section', ylabel='Depth (m)',
aspect=1)
ax.invert_yaxis()
ax.margins(0)
plt.show()
A key portion to understand is how matplotlib handles colormaps. Colormaps
take a scaled, 0 to 1 range and convert it to a color. Scaling the "raw"
data to a 0 to 1 range is handled by a `Normalize` instance (by default, it
just scales from the min of the data to the max). Because we want to link
specific values to specific colors, we'll need both a norm and a colormap.
Fortunately, there's a function that creates both given a set of levels and
colors: `matplotlib.colors.from_levels_and_colors`.
I'm using `pcolormesh` to plot the individual rectangles that make up the
stratigraphic section. If you need more flexibility (e.g. a different
width for each lithology), you could iterate over each interval and plot an
individual rectangle. However, for the example you described, `pcolormesh`
is a good fit.
The part of this that's the hardest to understand is converting the 1D
arrays to 2D for pcolormesh. `pcolormesh` expects the input x, y, z arrays
to be 2D. We could tile (repeat) the arrays, but in this case it's easiest
to add an extra "singleton" dimension by slicing with `None`. This winds
up having the same effect as tiling the arrays when the arrays are
"broadcast" together. If you're having trouble understanding this part
(and how it relates to the corners of the quadrilaterals that `pcolormesh`
makes), I'd be happy to show some more examples.
Hope that helps a bit, at any rate.
-Joe
?
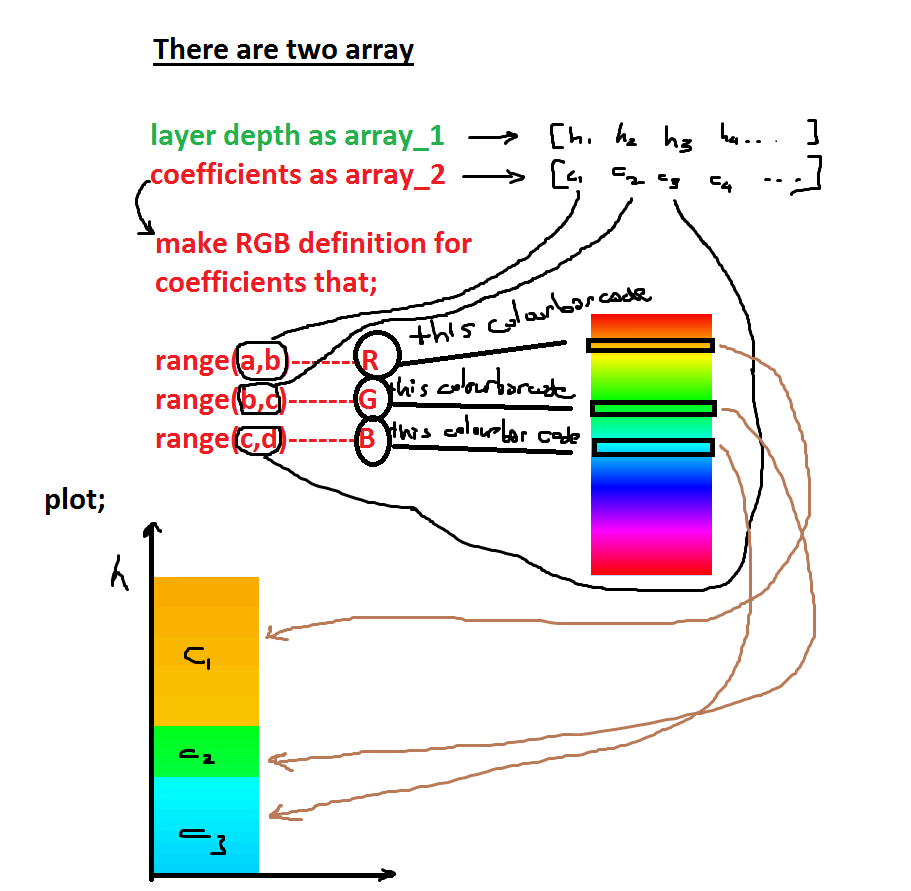
Hi.My name is Ekrem,Geophysicist.I have a question that about
matplotlib.What is your suggestion about matplotlib codes?I think that
explanation as schematic is very understandable.That;
very thanks for your suggestion code
_______________________________________________
Matplotlib-users mailing list
Matplotlib-users at python.org
Matplotlib-users Info Page
-------------- next part --------------
An HTML attachment was scrubbed...
URL: <http://mail.python.org/pipermail/matplotlib-users/attachments/20151202/5f781d73/attachment-0001.html>
-------------- next part --------------
A non-text attachment was scrubbed...
Name: pastedImage.png
Type: image/png
Size: 81120 bytes
Desc: not available
URL: <http://mail.python.org/pipermail/matplotlib-users/attachments/20151202/5f781d73/attachment-0002.png>
-------------- next part --------------
A non-text attachment was scrubbed...
Name: figure_1-1.png
Type: image/png
Size: 16325 bytes
Desc: not available
URL: <http://mail.python.org/pipermail/matplotlib-users/attachments/20151202/5f781d73/attachment-0003.png>
···
On Tue, Dec 1, 2015 at 11:00 AM, Ekrem _ <ekrem1982 at hotmail.com> wrote: