Hello all,
I’m playing with FFT currently.
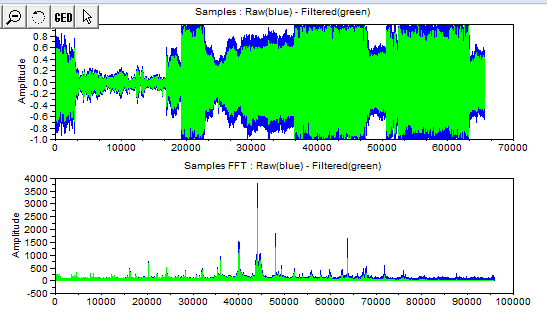
Here is the display under scilab (from wich
I’m proting the code to matplotlib)
And the display under matplotlib :
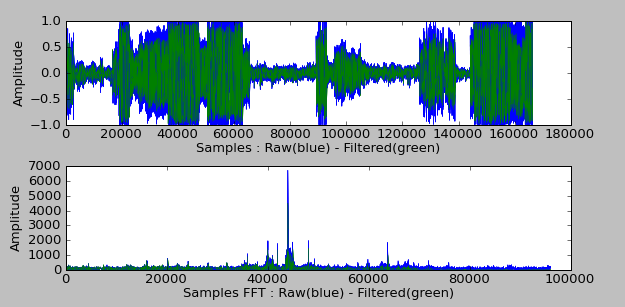
Display under matplotlib is done via: plot(freq,
abs(FreqI[0:len(FreqI)/2+1]), ‘b’, linewidth=.25)
To match let say “granularity”
of scilab I had to add linewidth=.25.
What is the best linewidth value there, I
mean to use 1 pixel for each frequency?
.25 is not so bad but still blurry.
.1 gives excellent result but seems like if
I have applied an alpha value:
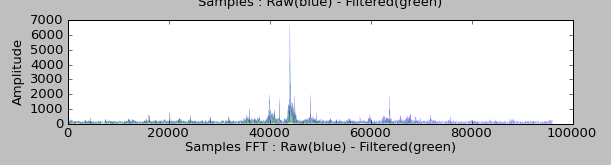
Is it possible to get .1 result but with
more stronger colors (without alpha effect?)?
Cheers,
Laurent
Laurent Dufrechou wrote:
Hello all,
I’m playing with FFT currently.
Here is the display under scilab (from wich I’m proting the code to matplotlib)
And the display under matplotlib :
Display under matplotlib is done via: plot(freq, abs(FreqI[0:len(FreqI)/2+1]), 'b', linewidth=.25)
To match let say “granularity” of scilab I had to add linewidth=.25.
What is the best linewidth value there, I mean to use 1 pixel for each frequency?
.25 is not so bad but still blurry.
.1 gives excellent result but seems like if I have applied an alpha value:
Is it possible to get .1 result but with more stronger colors (without alpha effect?)?
I suspect that what you are calling the alpha effect (or the blurry effect with 0.25) is really antialiasing, which scilab likely does not have. You can turn it off by adding the aa=False kwarg setting to your plot command.
Eric
···
Cheers,
Laurent
------------------------------------------------------------------------
-------------------------------------------------------------------------
This SF.Net email is sponsored by the Moblin Your Move Developer's challenge
Build the coolest Linux based applications with Moblin SDK & win great prizes
Grand prize is a trip for two to an Open Source event anywhere in the world
http://moblin-contest.org/redirect.php?banner_id=100&url=/
------------------------------------------------------------------------
_______________________________________________
Matplotlib-users mailing list
Matplotlib-users@lists.sourceforge.net
matplotlib-users List Signup and Options