Hi all,
I have a suggestion to make regarding the default results for legends when plots have both lines and markers. Consider the following plot commands:
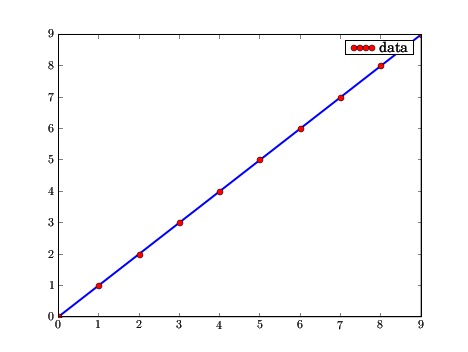
plot(range(10),marker='o',linestyle='-',markerfacecolor='r',label='data')
legend()
I've attached a small png of what I get on my system, with a very recent svn build.
This is a common (at least for me) way to plot data points with a line for visual aid connecting the dots.
What I think could be improved in the default behavior is the legend. I'm sure there's a way to get the result even today, I'm just advocating for an improved out-of-the-box output. Currently, the code puts so many markers in the legend that the line is not visible. This isn't very pretty, nor very useful. In contrast, I think the gnuplot default behavior is a lot better, see this page for a simple example (no, I don't think that graph looks better than mpl, I just think the way /legend/ labels are created is clearer):
http://www.sbml.org/software/libsbml/libsbml-vs-xerces-dom-memusage.png
What I think would be a better default legend behavior than the current one would be either (ascii art, with 0 denoting a marker and - a line):
(a) 0---0 OR (b) --0--
meaning two markers bracketing a bit of the line, or (like gnuplot) two line segments bracketing a single marker. The advantage of (a) IMO is that with dashed lines it is easier to read than (b), since there's a longer continuous section of line.
Just a suggestion...
f