Hi Everyone,
I’ve compiled matplotlib from svn (0.98.6svn) and I tried running the following sample:
import pylab as pl
from numpy import *
import mpl_toolkits.mplot3d.axes3d as axes3d
# x y head
head = ((25, 225 , 240.1178), #h1
(75, 225, 242.3238),#h2
(125, 225, 244.8013),#h3
(175, 225, 247.2736),
(225, 225, 248.8057),#h5
    (25, 175 ,  241.7646), #h6
    (75,  175,  242.0468),#h7
    (175,   175, 248.2085),  #h8
    (225,   175,    249.1382),#h9
    (25,   125,    243.1239), #h10
    (225, 125 , 249.5332), #h11

    (25,  75,  244.4780),#h12
    (75,   75, 245.1523),  #h13
    (175,   75,    248.9717),#h14
    (225,   75,    249.4562),#h15
    (25, 25 ,  245.1523), #h16
    (75,  25,  245.8214),#h17

    (125,   25, 247.1543),  #h18
    (175,   25,    248.4819),#h19
    (225,   25,    249.3144)) #h20
x, y, z = zip(*head)
xi, yi = pl.arange(0, 250, 1), pl.arange(0, 250, 1) #create grid
head = pl.griddata(x, y, z, xi, yi) #interpolate the scattered data !
#print shape(head)
#print shape(xi)
#print shape(yi)
f = pl.figure(1)
pl.scatter(x, y)
pl.contour(xi, yi, head)
pl.colorbar() # draw colorbar
#pl.show()
f = pl.figure(2)
ax = axes3d.Axes3D(f)
#X,Y,Z = axes3d.get_test_data(0.05)
cset = ax.contourf3D(xi,yi,head)
ax.clabel(cset, fontsize=9, inline=1)
ax.set_xlabel(‘X’)
ax.set_ylabel(‘Y’)
ax.set_zlabel(‘Hydraulic Head’)
f = pl.figure(3)
ax = axes3d.Axes3D(f)
#X,Y,Z = axes3d.get_test_data(0.05)
cset = ax.contour3D(xi,yi,head)
ax.clabel(cset, fontsize=9, inline=1)
ax.set_xlabel(‘X’)
ax.set_ylabel(‘Y’)
ax.set_zlabel(‘Hydraulic Head’)
f = pl.figure()
print shape(xi), shape(yi), shape(head)
[X,Y]=meshgrid(xi,yi)
print shape(X),shape(Y)
ax = axes3d.Axes3D(f)
#X,Y,Z = axes3d.get_test_data(0.05)
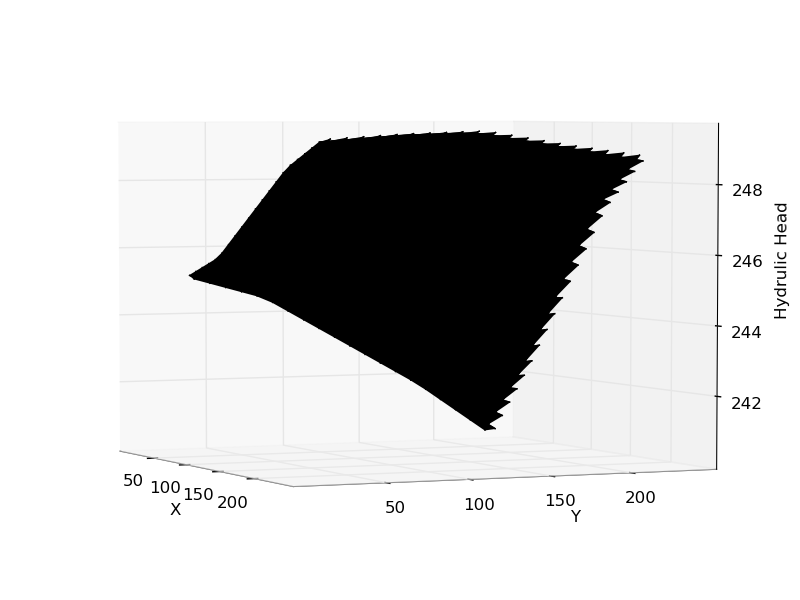
ax.plot_surface(X,Y,head, rstride=10,cstride=10)
ax.set_xlabel(‘X’)
ax.set_ylabel(‘Y’)
ax.set_zlabel(‘Hydrulic Head’)
pl.show()
Everything is working fine except the surface plot which results in a weird black surface.
How do I control the parameters of the surface ? I could not really understand the python code underlying of axes3d.py
I attached a screenshot to see
Any help would be appreciated,
thanks,
Oz Nahum,
Graduate Student,
Center for Applied Geosciences
Univesität Tübingen
···
–
        Imagine there's no countries
        It isn't hard to do
        Nothing to kill or die for

        And no religion too
        Imagine all the people
        Living life in peace