Dear all,
I've got two questions concerning axis in 3d plots.
When I do something similar to my minimal working example (see below), then I see a grid and light gray filling forming half a cube.
1. How do I turn off this cube in z-direction, so that the x-y-plane still has got the ticks and labels, but there is no x-z-plane, nor a y-z-plane.
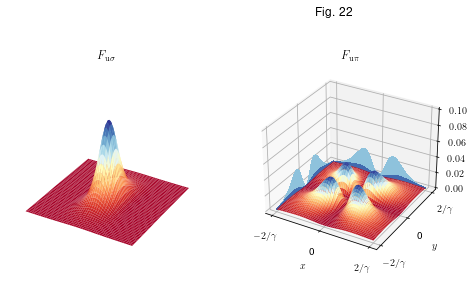
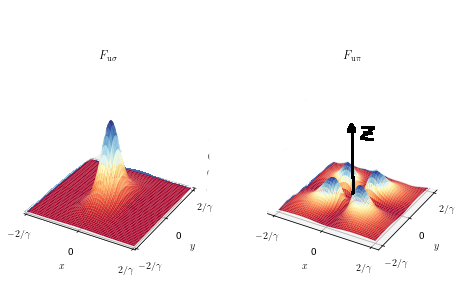
In the first attached image there is how far I got and the other image is what I intend to have.
In the left plot, there I turned off the axis (`ax2.axis('off')`, but this also turns off the x-y-plane and in the right plot there is the box.
2. The best case would be that I get the right plot with a shifted dedicated z-axis, but I haven't looked into creating such new axis, yet.
Unfortunately, I couldn't find an option like `ax2.axis(x=True,y=True,z=False)` or `plt.grid('no-z')` and the 3d examples from the gallery also include all this box, even the frontpage example[1] which has no ticks.
Also emptying the ticks and labels in z still leaves the gray box (trick 1 in MWE). And trying to hide them behind a white surface (trick 2 in MWE) still leaves a small grey border.
···
---------------------
Minimal Working Example
# MWE
import matplotlib.pyplot as plt
from matplotlib import cm
from mpl_toolkits.mplot3d import Axes3D
import numpy as np
# sample data
x = np.linspace(-2, 2, 10)
y = np.linspace(-2, 2, 10)
X, Y = np.meshgrid(x, y)
def fun(x, y):
return x + y
Z = fun(X, Y)
# plotting problem
fig = plt.figure()
ax1 = fig.add_subplot(1, 1, 1, projection='3d', frame_on=False, )
surf1 = ax1.plot_surface(X, Y, Z, linewidth=0, antialiased=True, cmap=cm.RdYlBu)
# trick 1
ax1.set_zticks()
ax1.set_zticklabels()
ax1.grid(False)
# trick 2
ax1.contourf(X, Y,
np.array([np.ones_like(Z)[-1, :] * i for i in np.linspace(-4, 4, 10)]).T,
zdir='x', offset=-2, colors="white")
ax1.set_xlim(-2,2)
ax1.set_ylim(-2,2)
---------------------
[1] Frontpage 3D example — Matplotlib 3.3.4 documentation
I hope, I could make my intention and attempts clear, hope a solution exists and someone here knows of it and can tell me how to proceed.
Thank you very much in advance,
Julian